
 Yahoo Finance
 The 150-year-old chart that predicts the stock market
After the worst year for stocks since the financial crisis and fears of a fresh global banking crisis, investors are looking for ways to navigate choppy markets.
Now a dusty old chart from the 1800s may give them the means to do just that.
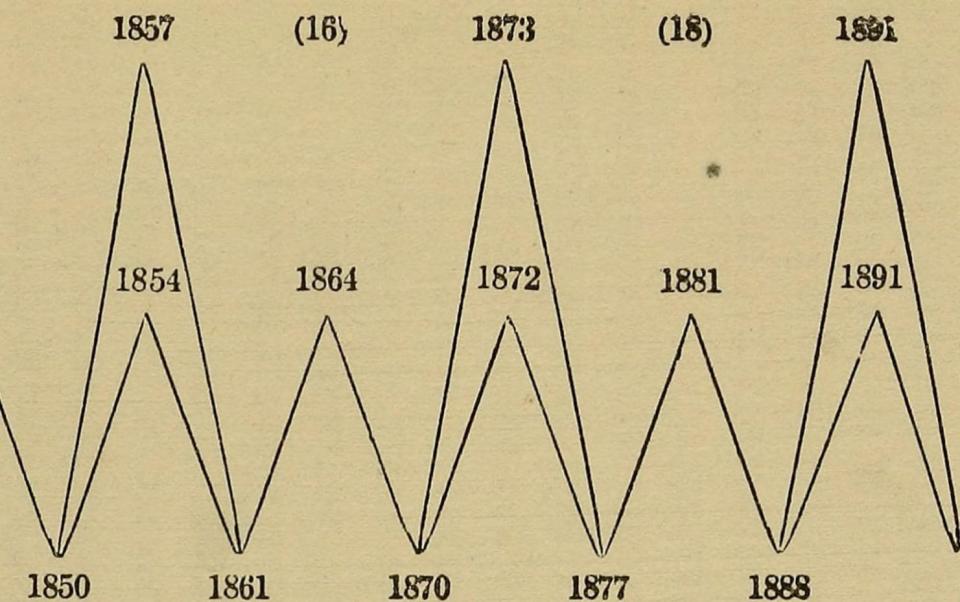
In the late nineteenth century, an American farmer from Ohio called Samuel Benner created a chart forecasting the rise and fall in the average price of hogs, corn and pig-iron. Since then, it has been weirdly accurate at predicting ups and downs of global stock markets – seeming foreseeing the Wall Street Crash, the Second World War, and the dot-com bubble.
The 150-year-old chart – which tells investors when to sell and when to buy – earned Benner national renown as an economic prophet. Newspapers of the time reprinted his “surprisingly accurate” forecasts, which are still being referred to today by retail investors sharing the so-called Benner Cycle on social media.
His original cycle only went as far as 1891. It is thought another nineteenth century forecaster, George Tritch, extended the cycle all the way up to 2059 and published the chart, annotating it with instructions of when to buy and sell stocks.
The chart tells investors to sell in 2007, just before the financial crash. It also says that 2023 will be a year of “low prices” when investors should buy and hold – which, given last year's share price falls, complies with the logic of “selling high and buying low”.
Benner wrote Benner's Prophecies of Future Ups and Downs in Prices after seeing his assets wiped out in the Panic of 1873. He identified an 11-year cycle in corn and hog prices, as well as a 27-year cycle in the price of pig iron.
There are a few reasons why the chart has been strangely accurate so far. It is based on the theory that solar cycles impact crop yields, affecting agricultural supply and causing ups and downs in commodity prices.
Rob Burgeman of wealth manager RBC Brewin Dolphin says the chart also highlights the cyclical nature of stock markets, which he says are “ruled by the primitive emotions of fear and greed and how these sentiments contribute in the short term and the long term to the volatility of markets”.
However, investors should demonstrate caution before they buy or sell their holdings based on the instructions of the nineteenth century hog farmer, as not all of Benner’s prophecies have come true.
Jason Hollands of investment firm Bestinvest says: “While there is seemingly some uncanny correlation to trends in wider financial markets, it did not predict the 2008 global financial crisis and was a year early in respect of the pandemic.”
The chart has possibly become less accurate over time as the driving forces of the global economy have shifted. In his book, Benner called pig-iron the “monarch of business”.
A lot has changed since then, Hollands says. “I would argue that since countries moved to fiat currencies in the late 20th century, the single biggest driver of financial markets have been the ebbs and flows in the supply of money driven by central banks. We are seeing this play out at the moment as the world has rapidly exited an era of ultra-low rates and money printing.”
Investors should also probably avoid using a theory based on the solar cycle to try and predict stock markets. But there are other patterns that investors use when deciding whether to buy or sell, and some of them are fairly reliable.
“These include the notion that you should avoid the markets in the summer ('sell in May, go away, come again on St. Leger’s day') and the often strong performance of markets in December (a phenomena known as the Santa Rally),” Hollands says.
In the case of ‘sell in May’, while returns have historically been more muted over the summer months, long term average returns are still positive during these months, so not sufficiently convincing a pattern to dogmatically sell up each year. The Santa Rally is more convincing. Over the last 50 years the MSCI World Index has delivered a positive return 76pc of the time in the month of December which is far higher than any other month.
For Burgeman, there is a modern day oracle whose advice investors should follow instead of Benner’s.
“As so often, perhaps we should listen a little more to the sage of Omaha, Warren Buffet, whose mantra is ‘be greedy when others are fearful, but fearful when they are greedy'," he says.
