
 Yahoo Finance
 25 Major Cities Where the Value of Your Paycheck Is Plummeting

Amid high food inflation and rising cost of living, the paychecks for many Americans don’t quite stretch the way they once did. Now, data shows your paycheck’s value actively declines depending on your location.
Learn More: What Is the Median Household Income for the Upper Middle Class in 2024?
Read Next: Become a Real Estate Investor for Just $1K Using This Bezos-Backed Startup
To determine which major cities have plummeting paycheck values, GOBankingRates sourced the total population, total households, median household income and selected monthly owner cost as a percentage of household income from the U.S. Census’s American Community Survey. Each city’s cost-of-living index was sourced. Expenditure and average rental costs were also sourced and calculated for each city and added together to determine the total cost of living per month and year in each city. The total cost of living was then taken out of the median household income to show the leftover savings.
Ranked in ascending order, see if you reside in one of these 25 cities where paycheck value is declining.

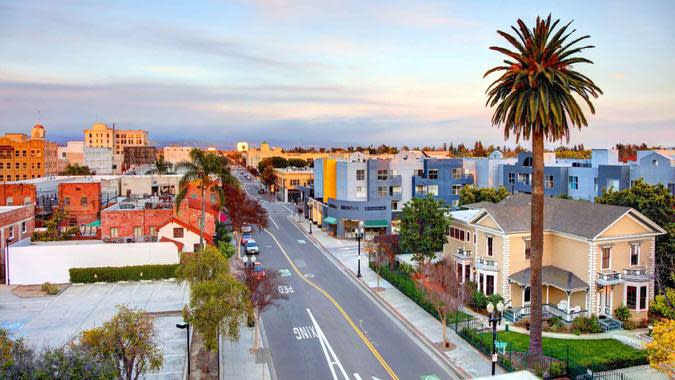
25. Orlando, Florida
Total monthly CoL (expenditures + rent): $4,033.88
Total annual CoL (expenditures + rent): $48,406.59
Household median income: $66,292
Savings after total annual CoL: $17,885
Total population: 307,738
Total households: 122,607
Households that pay > 35% income to selected monthly owner costs: 20.03%
See More: I’m an Economist: Here Are My Predictions for Inflation If Biden Wins Again
Check Out: Owe Money to the IRS? Most People Don’t Realize They Should Do This One Thing
Wealthy people know the best money secrets. Learn how to copy them.

24. Sacramento, California
Total monthly CoL (expenditures + rent): $4,336.17
Total annual CoL (expenditures + rent): $52,034.08
Household median income: $78,954
Savings after total annual CoL: $26,920
Total population: 523,600
Total households: 196,524
Households that pay > 35% income to selected monthly owner costs: 20.91%
Discover More: Here’s the Living Wage a Single Person Needs To Live Comfortably in Arizona

23. Buffalo, New York
Total monthly CoL (expenditures + rent): $3,495.54
Total annual CoL (expenditures + rent): $41,946.43
Household median income: $46,184
Savings after total annual CoL: $4,238
Total population: 276,688
Total households: 118,897
Households that pay > 35% income to selected monthly owner costs: 13.97%

22. Irvine, California
Total monthly CoL (expenditures + rent): $5,839.06
Total annual CoL (expenditures + rent): $70,068.66
Household median income: $122,948
Savings after total annual CoL: $52,879
Total population: 304,527
Total households: 110,465
Households that pay > 35% income to selected monthly owner costs: 22.78%

21. Richmond, Virginia
Total monthly CoL (expenditures + rent): $3,707.13
Total annual CoL (expenditures + rent): $44,485.55
Household median income: $59,606
Savings after total annual CoL: $15,120
Total population: 227,171
Total households: 101,201
Households that pay > 35% income to selected monthly owner costs: 20.41%

20. Detroit, Michigan
Total monthly CoL (expenditures + rent): $3,140.08
Total annual CoL (expenditures + rent): $37,680.95
Household median income: $37,761
Savings after total annual CoL: $80
Total population: 636,787
Total households: 249,518
Households that pay > 35% income to selected monthly owner costs: 21.69%
Check Out: 5 Changes That Could Be Coming for the Middle Class If Biden Is Reelected in 2024

19. Tampa, Florida
Total monthly CoL (expenditures + rent): $4,194.03
Total annual CoL (expenditures + rent): $50,328.36
Household median income: $66,802
Savings after total annual CoL: $16,474
Total population: 388,768
Total households: 157,066
Households that pay > 35% income to selected monthly owner costs: 20.39%

18. Cleveland, Ohio
Total monthly CoL (expenditures + rent): $3,222.63
Total annual CoL (expenditures + rent): $38,671.59
Household median income: $37,271
Savings after total annual CoL: $(1,401)
Total population: 370,365
Total households: 167,829
Households that pay > 35% income to selected monthly owner costs: 19.77%

17. Chicago, Illinois
Total monthly CoL (expenditures + rent): $4,117.46
Total annual CoL (expenditures + rent): $49,409.50
Household median income: $71,673
Savings after total annual CoL: $22,264
Total population: 2,721,914
Total households: 1,129,908
Households that pay > 35% income to selected monthly owner costs: 23.38%

16. Stockton, California
Total monthly CoL (expenditures + rent): $4,180.55
Total annual CoL (expenditures + rent): $50,166.60
Household median income: $71,612
Savings after total annual CoL: $21,445
Total population: 320,030
Total households: 96,975
Households that pay > 35% income to selected monthly owner costs: 22.50%
Learn More: What the Upper Middle Class Makes in Different US Cities

15. New Orleans, Louisiana
Total monthly CoL (expenditures + rent): $3,570.85
Total annual CoL (expenditures + rent): $42,850.17
Household median income: $51,116
Savings after total annual CoL: $8,266
Total population: 380,408
Total households: 155,669
Households that pay > 35% income to selected monthly owner costs: 24.47%

14. Philadelphia, Pennsylvania
Total monthly CoL (expenditures + rent): $3,793.29
Total annual CoL (expenditures + rent): $45,519.45
Household median income: $57,537
Savings after total annual CoL: $12,018
Total population: 1,593,208
Total households: 659,129
Households that pay > 35% income to selected monthly owner costs: 21.88%

13. Long Beach, California
Total monthly CoL (expenditures + rent): $4,394.78
Total annual CoL (expenditures + rent): $52,737.33
Household median income: $78,995
Savings after total annual CoL: $26,258
Total population: 462,293
Total households: 170,174
Households that pay > 35% income to selected monthly owner costs: $88,538

12. Anaheim, California
Total monthly CoL (expenditures + rent): $5,017.79
Total annual CoL (expenditures + rent): $60,213.52
Household median income: $88,538
Savings after total annual CoL: $28,324
Total population: 347,111
Total households: 104,671
Households that pay > 35% income to selected monthly owner costs: 23.06%
For You: Here’s How Much the Definition of Middle Class Has Changed in Every State

11. San Diego, California
Total monthly CoL (expenditures + rent): $5,367.43
Total annual CoL (expenditures + rent): $64,409.17
Household median income: $98,657
Savings after total annual CoL: $34,248
Total population: 1,383,987
Total households: 515,475
Households that pay > 35% income to selected monthly owner costs: 24.21%

10. Chula Vista, California
Total monthly CoL (expenditures + rent): $5,453.96
Total annual CoL (expenditures + rent): $65,447.50
Household median income: $101,984
Savings after total annual CoL: $36,536
Total population: 276,103
Total households: 83,074
Households that pay > 35% income to selected monthly owner costs: 26.05%

9. Oakland, California
Total monthly CoL (expenditures + rent): $5,010.83
Total annual CoL (expenditures + rent): $60,129.96
Household median income: $94,389
Savings after total annual CoL: $34,259
Total population: 437,825
Total households: 170,282
Households that pay > 35% income to selected monthly owner costs: 25.16%
8. Santa Ana, California
Total monthly CoL (expenditures + rent): $5,057.32
Total annual CoL (expenditures + rent): $60,687.82
Household median income: $84,210
Savings after total annual CoL: $23,522
Total population: 311,379
Total households: 77,553
Households that pay > 35% income to selected monthly owner costs: 23.99%
Explore More: 6 Reasons the Poor Stay Poor and Middle Class Doesn’t Become Wealthy

7. Jersey City, New Jersey
Total monthly CoL (expenditures + rent): $5,241.18
Total annual CoL (expenditures + rent): $62,894.21
Household median income: $91,151
Savings after total annual CoL: $28,257
Total population: 287,899
Total households: 119,278
Households that pay > 35% income to selected monthly owner costs: 28.94%

6. Los Angeles, California
Total monthly CoL (expenditures + rent): $4,979.18
Total annual CoL (expenditures + rent): $59,750.12
Household median income: $76,244
Savings after total annual CoL: $16,494
Total population: 3,881,041
Total households: 1,399,442
Households that pay > 35% income to selected monthly owner costs: 31.95%

5. Honolulu, Hawaii
Total monthly CoL (expenditures + rent): $5,029.53
Total annual CoL (expenditures + rent): $60,354.31
Household median income: $82,772
Savings after total annual CoL: $22,418
Total population: 348,547
Total households: 134,264
Households that pay > 35% income to selected monthly owner costs: 25.28%

4. Boston, Massachusetts
Total monthly CoL (expenditures + rent): $5,953.55
Total annual CoL (expenditures + rent): $71,442.60
Household median income: $89,212
Savings after total annual CoL: $17,769
Total population: 665,945
Total households: 276,053
Households that pay > 35% income to selected monthly owner costs: 21.70%
Find Out: Net Worth for Gen X: How To Tell If You’re Poor, Middle Class, Upper Middle Class or Rich

3. Miami, Florida
Total monthly CoL (expenditures + rent): $5,073.04
Total annual CoL (expenditures + rent): $60,876.46
Household median income: $54,858
Savings after total annual CoL: $(6,018)
Total population: 443,665
Total households: 186,137
Households that pay > 35% income to selected monthly owner costs: 30.10%

2. Newark, New Jersey
Total monthly CoL (expenditures + rent): $4,217.81
Total annual CoL (expenditures + rent): $50,613.75
Household median income: $46,460
Savings after total annual CoL: $(4,154)
Total population: 307,355
Total households: 112,635
Households that pay > 35% income to selected monthly owner costs: 39.90%

1. New York, New York
Total monthly CoL (expenditures + rent): $6,028.83
Total annual CoL (expenditures + rent): $72,345.95
Household median income: $76,607
Savings after total annual CoL: $4,261
Total population: 8,622,467
Total households: 3,282,804
Households that pay > 35% income to selected monthly owner costs: 28.65%
Methodology: For this study, GOBankingRates analyzed the top 100 major cities across the United States to find the places where the value of your paycheck is plummeting. GOBankingRates found the total population, total households, median household income, and Selected Monthly Owner Cost as a Percentage of Household Income all sourced from the US Census’s American Community Survey (DP04, S1901, DP05). For each city on the list the cost-of-living indexes were sourced from Sperling’s BestPlaces and using the average national expenditure costs the expenditure costs can be calculated for each city as sourced from the Bureau of Labor Statistics Consumer Expenditure Survey for all residents. The average rental cost for each city was sourced from Zillow Observed Rental Index and using the rental cost and the expenditure costs, the total cost of living for each city can be calculated for a month and a year. The total cost of living was taken out of the median household income to show the leftover savings for each city. The expenditure costs were scored and weighted at 1.00, the rental cost was scored and weighted at 1.00, the household median income was scored and weighted at 1.00, the leftover savings after Cost of living was scored and weighted at 1.00, and the selected monthly owner costs as a percentage of household income over 35% was scored and weighted at 1.00. All the scores were combined and sorted to show the major cities where the value of your paycheck is plummeting. All data was collected and is up to date as of June 24, 2024.
More From GOBankingRates
This article originally appeared on GOBankingRates.com: 25 Major Cities Where the Value of Your Paycheck Is Plummeting
