
 Yahoo Finance
 These 4 Measures Indicate That T-Mobile US (NASDAQ:TMUS) Is Using Debt Extensively
Legendary fund manager Li Lu (who Charlie Munger backed) once said, 'The biggest investment risk is not the volatility of prices, but whether you will suffer a permanent loss of capital.' So it might be obvious that you need to consider debt, when you think about how risky any given stock is, because too much debt can sink a company. As with many other companies T-Mobile US, Inc. (NASDAQ:TMUS) makes use of debt. But is this debt a concern to shareholders?
When Is Debt Dangerous?
Generally speaking, debt only becomes a real problem when a company can't easily pay it off, either by raising capital or with its own cash flow. Part and parcel of capitalism is the process of 'creative destruction' where failed businesses are mercilessly liquidated by their bankers. However, a more frequent (but still costly) occurrence is where a company must issue shares at bargain-basement prices, permanently diluting shareholders, just to shore up its balance sheet. Having said that, the most common situation is where a company manages its debt reasonably well - and to its own advantage. The first thing to do when considering how much debt a business uses is to look at its cash and debt together.
View our latest analysis for T-Mobile US
How Much Debt Does T-Mobile US Carry?
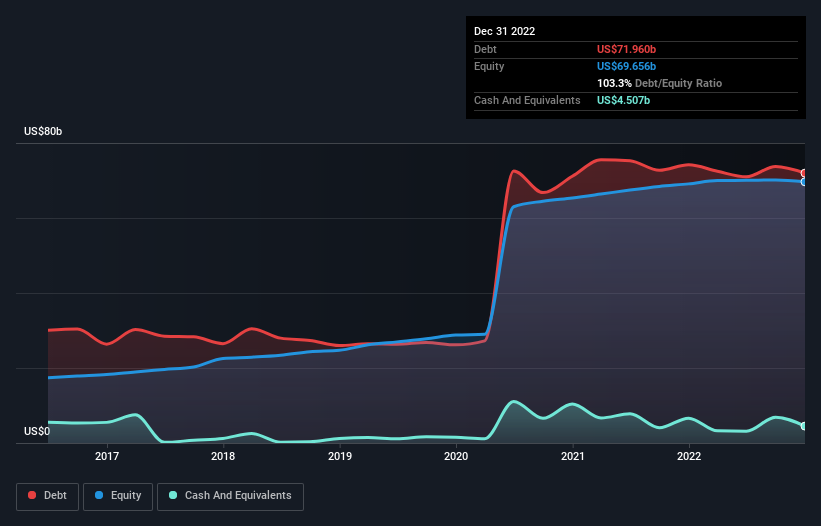
The chart below, which you can click on for greater detail, shows that T-Mobile US had US$72.0b in debt in December 2022; about the same as the year before. However, because it has a cash reserve of US$4.51b, its net debt is less, at about US$67.5b.
A Look At T-Mobile US' Liabilities
According to the last reported balance sheet, T-Mobile US had liabilities of US$24.7b due within 12 months, and liabilities of US$116.9b due beyond 12 months. Offsetting this, it had US$4.51b in cash and US$9.92b in receivables that were due within 12 months. So its liabilities outweigh the sum of its cash and (near-term) receivables by US$127.3b.
This is a mountain of leverage even relative to its gargantuan market capitalization of US$180.7b. This suggests shareholders would be heavily diluted if the company needed to shore up its balance sheet in a hurry.
In order to size up a company's debt relative to its earnings, we calculate its net debt divided by its earnings before interest, tax, depreciation, and amortization (EBITDA) and its earnings before interest and tax (EBIT) divided by its interest expense (its interest cover). The advantage of this approach is that we take into account both the absolute quantum of debt (with net debt to EBITDA) and the actual interest expenses associated with that debt (with its interest cover ratio).
T-Mobile US has a debt to EBITDA ratio of 2.5 and its EBIT covered its interest expense 3.9 times. This suggests that while the debt levels are significant, we'd stop short of calling them problematic. Importantly, T-Mobile US grew its EBIT by 31% over the last twelve months, and that growth will make it easier to handle its debt. The balance sheet is clearly the area to focus on when you are analysing debt. But ultimately the future profitability of the business will decide if T-Mobile US can strengthen its balance sheet over time. So if you're focused on the future you can check out this free report showing analyst profit forecasts.
Finally, while the tax-man may adore accounting profits, lenders only accept cold hard cash. So we always check how much of that EBIT is translated into free cash flow. Over the last three years, T-Mobile US saw substantial negative free cash flow, in total. While that may be a result of expenditure for growth, it does make the debt far more risky.
Our View
Neither T-Mobile US's ability to convert EBIT to free cash flow nor its level of total liabilities gave us confidence in its ability to take on more debt. But its EBIT growth rate tells a very different story, and suggests some resilience. Taking the abovementioned factors together we do think T-Mobile US's debt poses some risks to the business. While that debt can boost returns, we think the company has enough leverage now. When analysing debt levels, the balance sheet is the obvious place to start. However, not all investment risk resides within the balance sheet - far from it. We've identified 3 warning signs with T-Mobile US , and understanding them should be part of your investment process.
When all is said and done, sometimes its easier to focus on companies that don't even need debt. Readers can access a list of growth stocks with zero net debt 100% free, right now.
Have feedback on this article? Concerned about the content? Get in touch with us directly. Alternatively, email editorial-team (at) simplywallst.com.
This article by Simply Wall St is general in nature. We provide commentary based on historical data and analyst forecasts only using an unbiased methodology and our articles are not intended to be financial advice. It does not constitute a recommendation to buy or sell any stock, and does not take account of your objectives, or your financial situation. We aim to bring you long-term focused analysis driven by fundamental data. Note that our analysis may not factor in the latest price-sensitive company announcements or qualitative material. Simply Wall St has no position in any stocks mentioned.
Join A Paid User Research Session
You’ll receive a US$30 Amazon Gift card for 1 hour of your time while helping us build better investing tools for the individual investors like yourself. Sign up here
