
 Yahoo Finance
 With 43% stake, Y-mAbs Therapeutics, Inc. (NASDAQ:YMAB) seems to have captured institutional investors' interest
Key Insights
Significantly high institutional ownership implies Y-mAbs Therapeutics' stock price is sensitive to their trading actions
The top 9 shareholders own 53% of the company
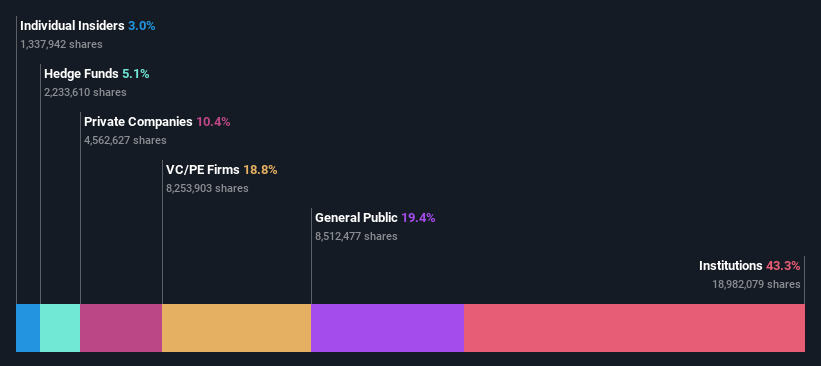
If you want to know who really controls Y-mAbs Therapeutics, Inc. (NASDAQ:YMAB), then you'll have to look at the makeup of its share registry. We can see that institutions own the lion's share in the company with 43% ownership. That is, the group stands to benefit the most if the stock rises (or lose the most if there is a downturn).
Given the vast amount of money and research capacities at their disposal, institutional ownership tends to carry a lot of weight, especially with individual investors. Hence, having a considerable amount of institutional money invested in a company is often regarded as a desirable trait.
Let's delve deeper into each type of owner of Y-mAbs Therapeutics, beginning with the chart below.
See our latest analysis for Y-mAbs Therapeutics
What Does The Institutional Ownership Tell Us About Y-mAbs Therapeutics?
Many institutions measure their performance against an index that approximates the local market. So they usually pay more attention to companies that are included in major indices.
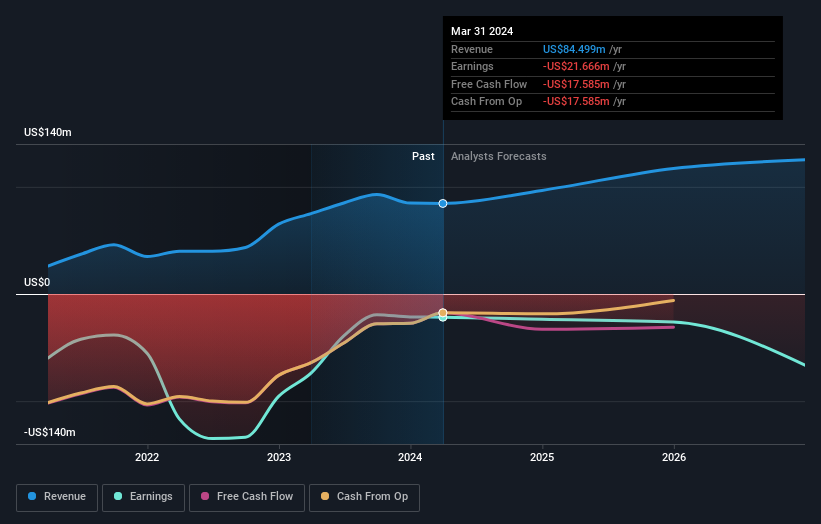
We can see that Y-mAbs Therapeutics does have institutional investors; and they hold a good portion of the company's stock. This can indicate that the company has a certain degree of credibility in the investment community. However, it is best to be wary of relying on the supposed validation that comes with institutional investors. They too, get it wrong sometimes. It is not uncommon to see a big share price drop if two large institutional investors try to sell out of a stock at the same time. So it is worth checking the past earnings trajectory of Y-mAbs Therapeutics, (below). Of course, keep in mind that there are other factors to consider, too.
Our data indicates that hedge funds own 5.1% of Y-mAbs Therapeutics. That's interesting, because hedge funds can be quite active and activist. Many look for medium term catalysts that will drive the share price higher. Looking at our data, we can see that the largest shareholder is Wg Biotech Aps with 10% of shares outstanding. In comparison, the second and third largest shareholders hold about 7.5% and 6.5% of the stock.
We did some more digging and found that 9 of the top shareholders account for roughly 53% of the register, implying that along with larger shareholders, there are a few smaller shareholders, thereby balancing out each others interests somewhat.
While it makes sense to study institutional ownership data for a company, it also makes sense to study analyst sentiments to know which way the wind is blowing. There are plenty of analysts covering the stock, so it might be worth seeing what they are forecasting, too.
Insider Ownership Of Y-mAbs Therapeutics
While the precise definition of an insider can be subjective, almost everyone considers board members to be insiders. Company management run the business, but the CEO will answer to the board, even if he or she is a member of it.
I generally consider insider ownership to be a good thing. However, on some occasions it makes it more difficult for other shareholders to hold the board accountable for decisions.
Our most recent data indicates that insiders own some shares in Y-mAbs Therapeutics, Inc.. It has a market capitalization of just US$526m, and insiders have US$16m worth of shares, in their own names. It is good to see some investment by insiders, but it might be worth checking if those insiders have been buying.
General Public Ownership
With a 19% ownership, the general public, mostly comprising of individual investors, have some degree of sway over Y-mAbs Therapeutics. While this group can't necessarily call the shots, it can certainly have a real influence on how the company is run.
Private Equity Ownership
Private equity firms hold a 19% stake in Y-mAbs Therapeutics. This suggests they can be influential in key policy decisions. Some might like this, because private equity are sometimes activists who hold management accountable. But other times, private equity is selling out, having taking the company public.
Private Company Ownership
It seems that Private Companies own 10%, of the Y-mAbs Therapeutics stock. It might be worth looking deeper into this. If related parties, such as insiders, have an interest in one of these private companies, that should be disclosed in the annual report. Private companies may also have a strategic interest in the company.
Next Steps:
It's always worth thinking about the different groups who own shares in a company. But to understand Y-mAbs Therapeutics better, we need to consider many other factors. Be aware that Y-mAbs Therapeutics is showing 4 warning signs in our investment analysis , and 1 of those can't be ignored...
If you are like me, you may want to think about whether this company will grow or shrink. Luckily, you can check this free report showing analyst forecasts for its future.
NB: Figures in this article are calculated using data from the last twelve months, which refer to the 12-month period ending on the last date of the month the financial statement is dated. This may not be consistent with full year annual report figures.
Have feedback on this article? Concerned about the content? Get in touch with us directly. Alternatively, email editorial-team (at) simplywallst.com.
This article by Simply Wall St is general in nature. We provide commentary based on historical data and analyst forecasts only using an unbiased methodology and our articles are not intended to be financial advice. It does not constitute a recommendation to buy or sell any stock, and does not take account of your objectives, or your financial situation. We aim to bring you long-term focused analysis driven by fundamental data. Note that our analysis may not factor in the latest price-sensitive company announcements or qualitative material. Simply Wall St has no position in any stocks mentioned.
