
 Yahoo Finance
 The 8.6% return this week takes Sunnova Energy International's (NYSE:NOVA) shareholders three-year gains to 139%
The worst result, after buying shares in a company (assuming no leverage), would be if you lose all the money you put in. But when you pick a company that is really flourishing, you can make more than 100%. For example, the Sunnova Energy International Inc. (NYSE:NOVA) share price has soared 139% in the last three years. Most would be happy with that. It's also good to see the share price up 50% over the last quarter. The company reported its financial results recently; you can catch up on the latest numbers by reading our company report.
After a strong gain in the past week, it's worth seeing if longer term returns have been driven by improving fundamentals.
See our latest analysis for Sunnova Energy International
Sunnova Energy International wasn't profitable in the last twelve months, it is unlikely we'll see a strong correlation between its share price and its earnings per share (EPS). Arguably revenue is our next best option. When a company doesn't make profits, we'd generally expect to see good revenue growth. As you can imagine, fast revenue growth, when maintained, often leads to fast profit growth.
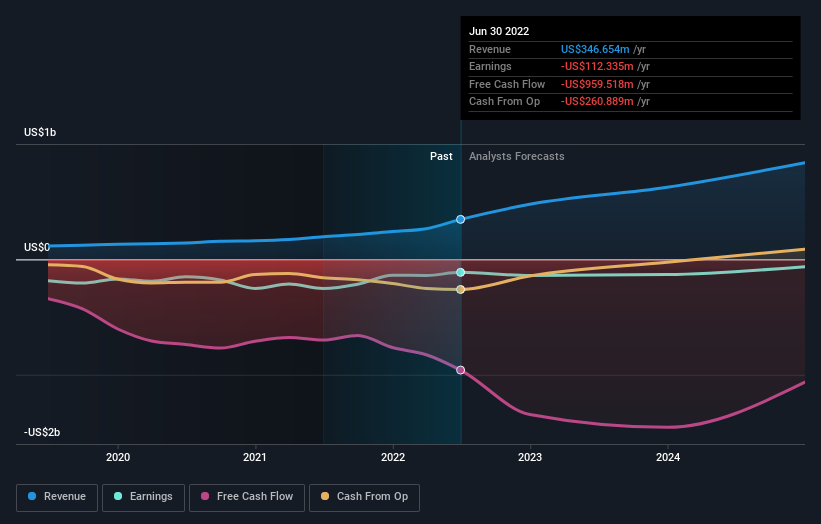
In the last 3 years Sunnova Energy International saw its revenue grow at 34% per year. That's much better than most loss-making companies. Along the way, the share price gained 34% per year, a solid pop by our standards. This suggests the market has recognized the progress the business has made, at least to a significant degree. That's not to say we think the share price is too high. In fact, it might be worth keeping an eye on this one.
You can see how earnings and revenue have changed over time in the image below (click on the chart to see the exact values).
We like that insiders have been buying shares in the last twelve months. Even so, future earnings will be far more important to whether current shareholders make money. If you are thinking of buying or selling Sunnova Energy International stock, you should check out this free report showing analyst profit forecasts.
A Different Perspective
The last twelve months weren't great for Sunnova Energy International shares, which performed worse than the market, costing holders 27%. The market shed around 11%, no doubt weighing on the stock price. Fortunately the longer term story is brighter, with total returns averaging about 34% per year over three years. The recent sell-off could be an opportunity if the business remains sound, so it may be worth checking the fundamental data for signs of a long-term growth trend. It's always interesting to track share price performance over the longer term. But to understand Sunnova Energy International better, we need to consider many other factors. Like risks, for instance. Every company has them, and we've spotted 4 warning signs for Sunnova Energy International (of which 1 is significant!) you should know about.
There are plenty of other companies that have insiders buying up shares. You probably do not want to miss this free list of growing companies that insiders are buying.
Please note, the market returns quoted in this article reflect the market weighted average returns of stocks that currently trade on US exchanges.
Have feedback on this article? Concerned about the content? Get in touch with us directly. Alternatively, email editorial-team (at) simplywallst.com.
This article by Simply Wall St is general in nature. We provide commentary based on historical data and analyst forecasts only using an unbiased methodology and our articles are not intended to be financial advice. It does not constitute a recommendation to buy or sell any stock, and does not take account of your objectives, or your financial situation. We aim to bring you long-term focused analysis driven by fundamental data. Note that our analysis may not factor in the latest price-sensitive company announcements or qualitative material. Simply Wall St has no position in any stocks mentioned.
Join A Paid User Research Session
You’ll receive a US$30 Amazon Gift card for 1 hour of your time while helping us build better investing tools for the individual investors like yourself. Sign up here
