
 Yahoo Finance
 AB Dynamics (LON:ABDP) shareholders have earned a 33% CAGR over the last five years
We think all investors should try to buy and hold high quality multi-year winners. And we've seen some truly amazing gains over the years. Just think about the savvy investors who held AB Dynamics plc (LON:ABDP) shares for the last five years, while they gained 306%. If that doesn't get you thinking about long term investing, we don't know what will. The last week saw the share price soften some 1.1%.
So let's investigate and see if the longer term performance of the company has been in line with the underlying business' progress.
See our latest analysis for AB Dynamics
To quote Buffett, 'Ships will sail around the world but the Flat Earth Society will flourish. There will continue to be wide discrepancies between price and value in the marketplace...' One way to examine how market sentiment has changed over time is to look at the interaction between a company's share price and its earnings per share (EPS).
During five years of share price growth, AB Dynamics actually saw its EPS drop 10% per year.
This means it's unlikely the market is judging the company based on earnings growth. Because earnings per share don't seem to match up with the share price, we'll take a look at other metrics instead.
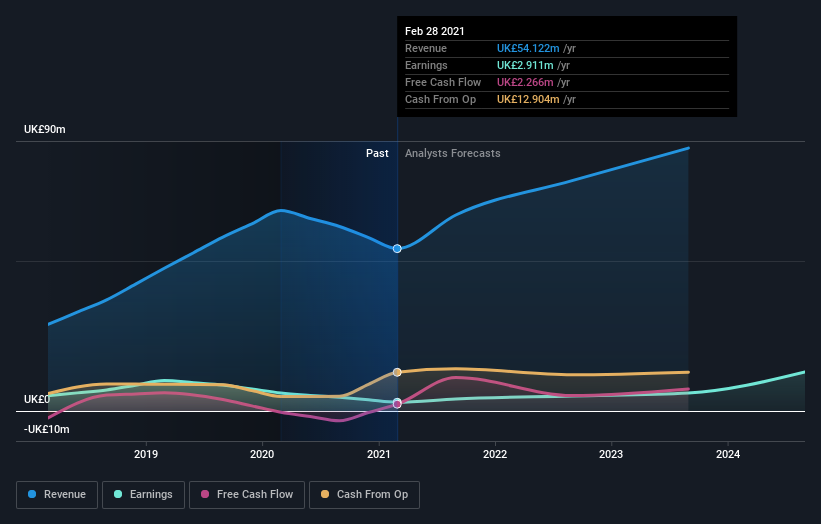
We doubt the modest 0.2% dividend yield is attracting many buyers to the stock. On the other hand, AB Dynamics' revenue is growing nicely, at a compound rate of 27% over the last five years. In that case, the company may be sacrificing current earnings per share to drive growth.
The company's revenue and earnings (over time) are depicted in the image below (click to see the exact numbers).
Balance sheet strength is crucial. It might be well worthwhile taking a look at our free report on how its financial position has changed over time.
What About Dividends?
It is important to consider the total shareholder return, as well as the share price return, for any given stock. Whereas the share price return only reflects the change in the share price, the TSR includes the value of dividends (assuming they were reinvested) and the benefit of any discounted capital raising or spin-off. Arguably, the TSR gives a more comprehensive picture of the return generated by a stock. We note that for AB Dynamics the TSR over the last 5 years was 313%, which is better than the share price return mentioned above. The dividends paid by the company have thusly boosted the total shareholder return.
A Different Perspective
AB Dynamics shareholders are down 12% for the year (even including dividends), but the market itself is up 28%. However, keep in mind that even the best stocks will sometimes underperform the market over a twelve month period. Longer term investors wouldn't be so upset, since they would have made 33%, each year, over five years. If the fundamental data continues to indicate long term sustainable growth, the current sell-off could be an opportunity worth considering. It's always interesting to track share price performance over the longer term. But to understand AB Dynamics better, we need to consider many other factors. Take risks, for example - AB Dynamics has 1 warning sign we think you should be aware of.
If you are like me, then you will not want to miss this free list of growing companies that insiders are buying.
Please note, the market returns quoted in this article reflect the market weighted average returns of stocks that currently trade on GB exchanges.
This article by Simply Wall St is general in nature. We provide commentary based on historical data and analyst forecasts only using an unbiased methodology and our articles are not intended to be financial advice. It does not constitute a recommendation to buy or sell any stock, and does not take account of your objectives, or your financial situation. We aim to bring you long-term focused analysis driven by fundamental data. Note that our analysis may not factor in the latest price-sensitive company announcements or qualitative material. Simply Wall St has no position in any stocks mentioned.
Have feedback on this article? Concerned about the content? Get in touch with us directly. Alternatively, email editorial-team (at) simplywallst.com.
