
 Yahoo Finance
 Able Global Berhad's (KLSE:ABLEGLOB) Stock Is Going Strong: Have Financials A Role To Play?
Able Global Berhad (KLSE:ABLEGLOB) has had a great run on the share market with its stock up by a significant 33% over the last three months. We wonder if and what role the company's financials play in that price change as a company's long-term fundamentals usually dictate market outcomes. Specifically, we decided to study Able Global Berhad's ROE in this article.
ROE or return on equity is a useful tool to assess how effectively a company can generate returns on the investment it received from its shareholders. Simply put, it is used to assess the profitability of a company in relation to its equity capital.
Check out our latest analysis for Able Global Berhad
How Is ROE Calculated?
Return on equity can be calculated by using the formula:
Return on Equity = Net Profit (from continuing operations) ÷ Shareholders' Equity
So, based on the above formula, the ROE for Able Global Berhad is:
12% = RM52m ÷ RM443m (Based on the trailing twelve months to December 2023).
The 'return' is the yearly profit. One way to conceptualize this is that for each MYR1 of shareholders' capital it has, the company made MYR0.12 in profit.
What Has ROE Got To Do With Earnings Growth?
Thus far, we have learned that ROE measures how efficiently a company is generating its profits. We now need to evaluate how much profit the company reinvests or "retains" for future growth which then gives us an idea about the growth potential of the company. Assuming everything else remains unchanged, the higher the ROE and profit retention, the higher the growth rate of a company compared to companies that don't necessarily bear these characteristics.
A Side By Side comparison of Able Global Berhad's Earnings Growth And 12% ROE
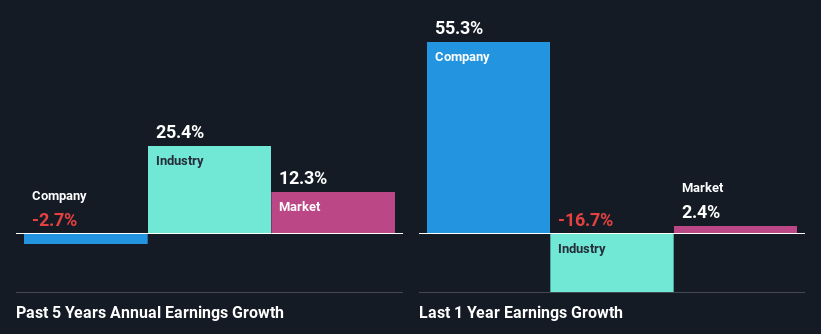
At first glance, Able Global Berhad seems to have a decent ROE. On comparing with the average industry ROE of 7.5% the company's ROE looks pretty remarkable. For this reason, Able Global Berhad's five year net income decline of 2.7% raises the question as to why the high ROE didn't translate into earnings growth. We reckon that there could be some other factors at play here that are preventing the company's growth. These include low earnings retention or poor allocation of capital.
That being said, we compared Able Global Berhad's performance with the industry and were concerned when we found that while the company has shrunk its earnings, the industry has grown its earnings at a rate of 25% in the same 5-year period.
The basis for attaching value to a company is, to a great extent, tied to its earnings growth. It’s important for an investor to know whether the market has priced in the company's expected earnings growth (or decline). By doing so, they will have an idea if the stock is headed into clear blue waters or if swampy waters await. One good indicator of expected earnings growth is the P/E ratio which determines the price the market is willing to pay for a stock based on its earnings prospects. So, you may want to check if Able Global Berhad is trading on a high P/E or a low P/E, relative to its industry.
Is Able Global Berhad Using Its Retained Earnings Effectively?
In spite of a normal three-year median payout ratio of 40% (that is, a retention ratio of 60%), the fact that Able Global Berhad's earnings have shrunk is quite puzzling. It looks like there might be some other reasons to explain the lack in that respect. For example, the business could be in decline.
Moreover, Able Global Berhad has been paying dividends for at least ten years or more suggesting that management must have perceived that the shareholders prefer dividends over earnings growth. Upon studying the latest analysts' consensus data, we found that the company is expected to keep paying out approximately 36% of its profits over the next three years. As a result, Able Global Berhad's ROE is not expected to change by much either, which we inferred from the analyst estimate of 11% for future ROE.
Conclusion
In total, it does look like Able Global Berhad has some positive aspects to its business. Although, we are disappointed to see a lack of growth in earnings even in spite of a high ROE and and a high reinvestment rate. We believe that there might be some outside factors that could be having a negative impact on the business. That being so, the latest industry analyst forecasts show that the analysts are expecting to see a huge improvement in the company's earnings growth rate. Are these analysts expectations based on the broad expectations for the industry, or on the company's fundamentals? Click here to be taken to our analyst's forecasts page for the company.
Have feedback on this article? Concerned about the content? Get in touch with us directly. Alternatively, email editorial-team (at) simplywallst.com.
This article by Simply Wall St is general in nature. We provide commentary based on historical data and analyst forecasts only using an unbiased methodology and our articles are not intended to be financial advice. It does not constitute a recommendation to buy or sell any stock, and does not take account of your objectives, or your financial situation. We aim to bring you long-term focused analysis driven by fundamental data. Note that our analysis may not factor in the latest price-sensitive company announcements or qualitative material. Simply Wall St has no position in any stocks mentioned.
