
 Yahoo Finance
 ACGL or ALL: Which P&C Insurance Stock Should You Buy Now?
Increased exposure, higher retention, streamlined operations, global presence, better pricing, solid underwriting and a strong capital position have helped the Zacks Property and Casualty Insurance industry perform well. The industry has risen 13% year to date, outperforming the Zacks S&P 500 composite’s rise of 10.8% and the Finance sector’s increase of 3.7%.
Per Fitch Ratings, an improved performance at personal auto, coupled with better investment results and lower claims, should fuel insurers' performance this year.
The performance of non-life insurers is affected by catastrophes. Per Aon’s Q1 Global Catastrophe Recap, total economic losses were more than $45 billion in the first quarter of 2024, while insured losses were $17 million, mostly driven by severe convective and winter storms in the United States, windstorms and flooding in Europe, and the Noto earthquake in Japan. According to AM Best, cat loss is estimated to contribute 680 basis points to the expected combined ratio of 100.7 in 2024.
An increase in catastrophe activities induces higher pricing. Global commercial insurance prices rose for 26 straight quarters, increasing 1% in the first quarter of 2024. However, the magnitude has slowed down, per Marsh Global Insurance Market Index. Improved pricing drives higher premiums, ensuring smooth claims settlement.
The insurance industry benefits from a rising rate environment. The Fed made four hikes in 2023, taking the tally to 11 since March 2022. Long-tail insurers are poised to benefit more. However, concerns over the Fed’s decision to cut rates loom.
The industry is continually undergoing technological developments to improve scale and efficiency. While a solid policyholders’ surplus helps the industry absorb losses, a sturdy capital level supports inorganic expansion, investment in growth initiatives and distribution of wealth to shareholders.
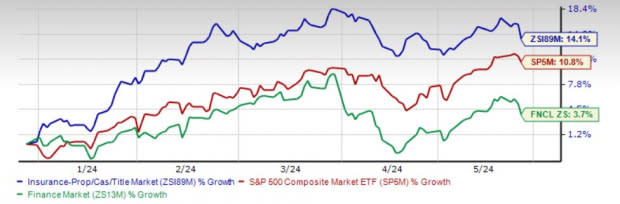
Image Source: Zacks Investment Research
Here, we focus on two property and casualty insurers, namely The Allstate Corporation ALL and Arch Capital Group Ltd. ACGL.
Allstate, with a market capitalization of $43.3 billion, is the third-largest property-casualty (P&C) insurer and the largest publicly-held personal lines carrier in the United States. Arch Capital, with a market capitalization of $38.3 billion, offers insurance, reinsurance and mortgage insurance across the world. The companies sport a Zacks Rank #1 (Strong Buy) each. You can see the complete list of today’s Zacks #1 Rank stocks here.
Let’s now see how these P&C insurers fare in terms of some of the key metrics.
Price Performance
ACGL has gained 37.2% year to date versus ALL’s rise of 17.2%. The industry has risen 14.2% in the said time frame.
Return on Equity
ACGL has a return on equity (“ROE”) of 21.8%, which is higher than ALL’s ROE of 14.4% and the industry average of 7.8%.
Return on Invested Capital
ACGL’s return on invested capital (“ROIC”) of 16.6% betters the industry average of 5.9% and ALL’s ROIC of 4.5%.
Dividend Yield
Allstate’s dividend yield of 2.5% exceeds the industry average of 0.3%. Arch Capital does not pay dividends.
Debt-to-Equity Ratio
ALL’s debt-to-equity ratio of 43 is higher than the industry average of 21.7 as well as ACGL’s reading of 16.3.
Growth Projection
The Zacks Consensus Estimate for ACGL’s 2024 earnings indicates a 1.2% increase from the year-ago reported figure, while that for ALL implies a year-over-year increase of 1,494.7%.
The Zacks Consensus Estimate for ACGL’s 2025 earnings indicates a 5.2% increase from the year-ago reported figure, while that for ALL implies a year-over-year increase of 14.4%.
The expected long-term earnings growth rate for ACGL is 5.1%, while that for ALL is 7%.
Net Margin
ACGL’s proforma net margin for the trailing 12 months was 33.7%, higher than ALL’s reading of 2.3%.
To Conclude
Our comparative analysis shows that ACGL has the edge over ALL with respect to price performance, return on capital, leverage and net margin. ALL outpaces ACGL in terms of dividend and growth projection.
Want the latest recommendations from Zacks Investment Research? Today, you can download 7 Best Stocks for the Next 30 Days. Click to get this free report
The Allstate Corporation (ALL) : Free Stock Analysis Report
Arch Capital Group Ltd. (ACGL) : Free Stock Analysis Report
