
 Yahoo Finance
 ACM Research's (NASDAQ:ACMR) five-year earnings growth trails the 34% YoY shareholder returns
It hasn't been the best quarter for ACM Research, Inc. (NASDAQ:ACMR) shareholders, since the share price has fallen 22% in that time. But over five years returns have been remarkably great. In fact, during that period, the share price climbed 326%. Impressive! So it might be that some shareholders are taking profits after good performance. The most important thing for savvy investors to consider is whether the underlying business can justify the share price gain.
The past week has proven to be lucrative for ACM Research investors, so let's see if fundamentals drove the company's five-year performance.
See our latest analysis for ACM Research
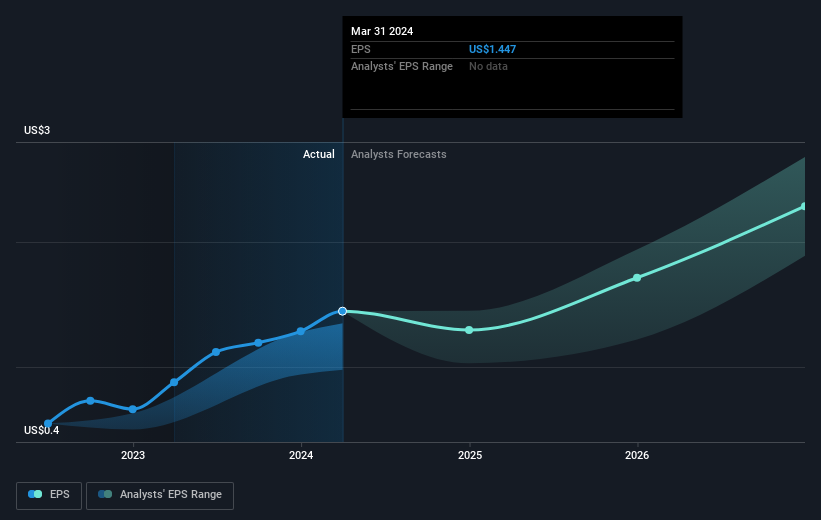
While the efficient markets hypothesis continues to be taught by some, it has been proven that markets are over-reactive dynamic systems, and investors are not always rational. One way to examine how market sentiment has changed over time is to look at the interaction between a company's share price and its earnings per share (EPS).
Over half a decade, ACM Research managed to grow its earnings per share at 43% a year. This EPS growth is higher than the 34% average annual increase in the share price. Therefore, it seems the market has become relatively pessimistic about the company.
The image below shows how EPS has tracked over time (if you click on the image you can see greater detail).
We know that ACM Research has improved its bottom line over the last three years, but what does the future have in store? You can see how its balance sheet has strengthened (or weakened) over time in this free interactive graphic.
A Different Perspective
It's nice to see that ACM Research shareholders have received a total shareholder return of 72% over the last year. Since the one-year TSR is better than the five-year TSR (the latter coming in at 34% per year), it would seem that the stock's performance has improved in recent times. Given the share price momentum remains strong, it might be worth taking a closer look at the stock, lest you miss an opportunity. It's always interesting to track share price performance over the longer term. But to understand ACM Research better, we need to consider many other factors. Take risks, for example - ACM Research has 2 warning signs (and 1 which shouldn't be ignored) we think you should know about.
Of course, you might find a fantastic investment by looking elsewhere. So take a peek at this free list of companies we expect will grow earnings.
Please note, the market returns quoted in this article reflect the market weighted average returns of stocks that currently trade on American exchanges.
Have feedback on this article? Concerned about the content? Get in touch with us directly. Alternatively, email editorial-team (at) simplywallst.com.
This article by Simply Wall St is general in nature. We provide commentary based on historical data and analyst forecasts only using an unbiased methodology and our articles are not intended to be financial advice. It does not constitute a recommendation to buy or sell any stock, and does not take account of your objectives, or your financial situation. We aim to bring you long-term focused analysis driven by fundamental data. Note that our analysis may not factor in the latest price-sensitive company announcements or qualitative material. Simply Wall St has no position in any stocks mentioned.
Have feedback on this article? Concerned about the content? Get in touch with us directly. Alternatively, email editorial-team@simplywallst.com
