
 Yahoo Finance
 ActiveOps (LON:AOM) investors are sitting on a loss of 30% if they invested a year ago
ActiveOps Plc (LON:AOM) shareholders should be happy to see the share price up 24% in the last quarter. But that doesn't change the reality of under-performance over the last twelve months. In fact, the price has declined 30% in a year, falling short of the returns you could get by investing in an index fund.
Since shareholders are down over the longer term, lets look at the underlying fundamentals over the that time and see if they've been consistent with returns.
Check out our latest analysis for ActiveOps
ActiveOps wasn't profitable in the last twelve months, it is unlikely we'll see a strong correlation between its share price and its earnings per share (EPS). Arguably revenue is our next best option. Generally speaking, companies without profits are expected to grow revenue every year, and at a good clip. That's because it's hard to be confident a company will be sustainable if revenue growth is negligible, and it never makes a profit.
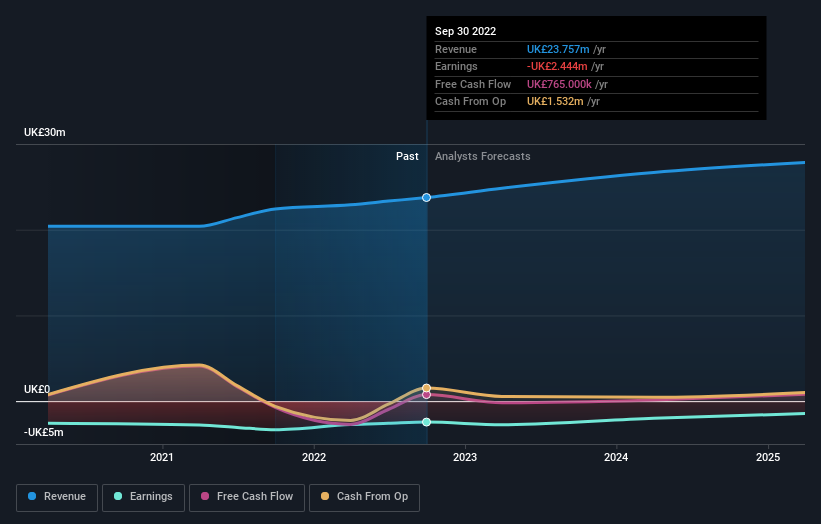
In the last twelve months, ActiveOps increased its revenue by 5.9%. That's not a very high growth rate considering it doesn't make profits. Given this fairly low revenue growth (and lack of profits), it's not particularly surprising to see the stock down 30% in a year. In a hot market it's easy to forget growth is the life-blood of a loss making company. So remember, if you buy a profitless company then you risk being a profitless investor.
The graphic below depicts how earnings and revenue have changed over time (unveil the exact values by clicking on the image).
We like that insiders have been buying shares in the last twelve months. Having said that, most people consider earnings and revenue growth trends to be a more meaningful guide to the business. So it makes a lot of sense to check out what analysts think ActiveOps will earn in the future (free profit forecasts).
A Different Perspective
Given that the market gained 12% in the last year, ActiveOps shareholders might be miffed that they lost 30%. However, keep in mind that even the best stocks will sometimes underperform the market over a twelve month period. Putting aside the last twelve months, it's good to see the share price has rebounded by 24%, in the last ninety days. This could just be a bounce because the selling was too aggressive, but fingers crossed it's the start of a new trend. It's always interesting to track share price performance over the longer term. But to understand ActiveOps better, we need to consider many other factors. For instance, we've identified 2 warning signs for ActiveOps that you should be aware of.
If you like to buy stocks alongside management, then you might just love this free list of companies. (Hint: insiders have been buying them).
Please note, the market returns quoted in this article reflect the market weighted average returns of stocks that currently trade on GB exchanges.
Have feedback on this article? Concerned about the content? Get in touch with us directly. Alternatively, email editorial-team (at) simplywallst.com.
This article by Simply Wall St is general in nature. We provide commentary based on historical data and analyst forecasts only using an unbiased methodology and our articles are not intended to be financial advice. It does not constitute a recommendation to buy or sell any stock, and does not take account of your objectives, or your financial situation. We aim to bring you long-term focused analysis driven by fundamental data. Note that our analysis may not factor in the latest price-sensitive company announcements or qualitative material. Simply Wall St has no position in any stocks mentioned.
Join A Paid User Research Session
You’ll receive a US$30 Amazon Gift card for 1 hour of your time while helping us build better investing tools for the individual investors like yourself. Sign up here
