
 Yahoo Finance
 Adobe Inc.'s (NASDAQ:ADBE) Fundamentals Look Pretty Strong: Could The Market Be Wrong About The Stock?
It is hard to get excited after looking at Adobe's (NASDAQ:ADBE) recent performance, when its stock has declined 6.8% over the past month. However, a closer look at its sound financials might cause you to think again. Given that fundamentals usually drive long-term market outcomes, the company is worth looking at. In this article, we decided to focus on Adobe's ROE.
ROE or return on equity is a useful tool to assess how effectively a company can generate returns on the investment it received from its shareholders. In simpler terms, it measures the profitability of a company in relation to shareholder's equity.
View our latest analysis for Adobe
How Do You Calculate Return On Equity?
The formula for ROE is:
Return on Equity = Net Profit (from continuing operations) ÷ Shareholders' Equity
So, based on the above formula, the ROE for Adobe is:
41% = US$5.8b ÷ US$14b (Based on the trailing twelve months to September 2021).
The 'return' is the income the business earned over the last year. That means that for every $1 worth of shareholders' equity, the company generated $0.41 in profit.
What Has ROE Got To Do With Earnings Growth?
Thus far, we have learned that ROE measures how efficiently a company is generating its profits. Based on how much of its profits the company chooses to reinvest or "retain", we are then able to evaluate a company's future ability to generate profits. Generally speaking, other things being equal, firms with a high return on equity and profit retention, have a higher growth rate than firms that don’t share these attributes.
Adobe's Earnings Growth And 41% ROE
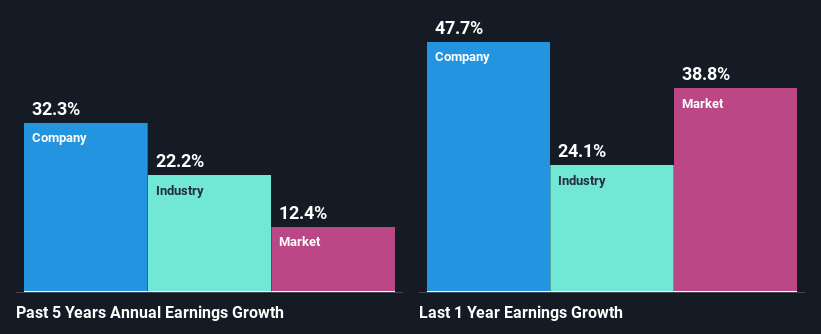
To begin with, Adobe has a pretty high ROE which is interesting. Additionally, the company's ROE is higher compared to the industry average of 12% which is quite remarkable. So, the substantial 32% net income growth seen by Adobe over the past five years isn't overly surprising.
We then compared Adobe's net income growth with the industry and we're pleased to see that the company's growth figure is higher when compared with the industry which has a growth rate of 22% in the same period.
Earnings growth is a huge factor in stock valuation. It’s important for an investor to know whether the market has priced in the company's expected earnings growth (or decline). Doing so will help them establish if the stock's future looks promising or ominous. Is ADBE fairly valued? This infographic on the company's intrinsic value has everything you need to know.
Is Adobe Making Efficient Use Of Its Profits?
Adobe doesn't pay any dividend to its shareholders, meaning that the company has been reinvesting all of its profits into the business. This is likely what's driving the high earnings growth number discussed above.
Conclusion
On the whole, we feel that Adobe's performance has been quite good. In particular, it's great to see that the company is investing heavily into its business and along with a high rate of return, that has resulted in a sizeable growth in its earnings. Having said that, the company's earnings growth is expected to slow down, as forecasted in the current analyst estimates. To know more about the latest analysts predictions for the company, check out this visualization of analyst forecasts for the company.
This article by Simply Wall St is general in nature. We provide commentary based on historical data and analyst forecasts only using an unbiased methodology and our articles are not intended to be financial advice. It does not constitute a recommendation to buy or sell any stock, and does not take account of your objectives, or your financial situation. We aim to bring you long-term focused analysis driven by fundamental data. Note that our analysis may not factor in the latest price-sensitive company announcements or qualitative material. Simply Wall St has no position in any stocks mentioned.
Have feedback on this article? Concerned about the content? Get in touch with us directly. Alternatively, email editorial-team (at) simplywallst.com.
