
 Yahoo Finance
 Is Adobe Inc.'s (NASDAQ:ADBE) Stock's Recent Performance Being Led By Its Attractive Financial Prospects?
Adobe's (NASDAQ:ADBE) stock is up by a considerable 18% over the past month. Given the company's impressive performance, we decided to study its financial indicators more closely as a company's financial health over the long-term usually dictates market outcomes. In this article, we decided to focus on Adobe's ROE.
Return on equity or ROE is a key measure used to assess how efficiently a company's management is utilizing the company's capital. In simpler terms, it measures the profitability of a company in relation to shareholder's equity.
Check out our latest analysis for Adobe
How To Calculate Return On Equity?
Return on equity can be calculated by using the formula:
Return on Equity = Net Profit (from continuing operations) ÷ Shareholders' Equity
So, based on the above formula, the ROE for Adobe is:
33% = US$4.7b ÷ US$14b (Based on the trailing twelve months to March 2023).
The 'return' is the yearly profit. That means that for every $1 worth of shareholders' equity, the company generated $0.33 in profit.
What Is The Relationship Between ROE And Earnings Growth?
Thus far, we have learned that ROE measures how efficiently a company is generating its profits. Based on how much of its profits the company chooses to reinvest or "retain", we are then able to evaluate a company's future ability to generate profits. Assuming everything else remains unchanged, the higher the ROE and profit retention, the higher the growth rate of a company compared to companies that don't necessarily bear these characteristics.
Adobe's Earnings Growth And 33% ROE
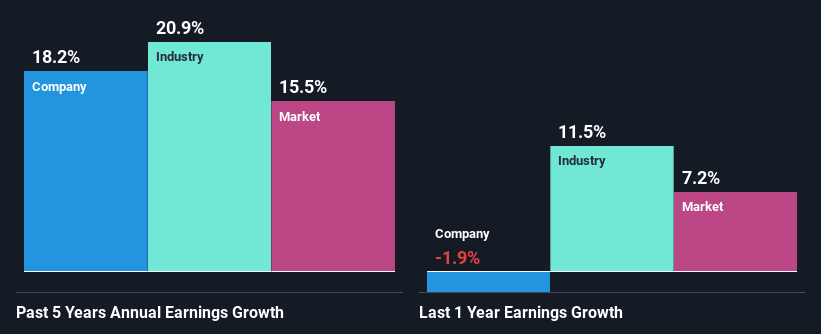
Firstly, we acknowledge that Adobe has a significantly high ROE. Secondly, even when compared to the industry average of 11% the company's ROE is quite impressive. This likely paved the way for the modest 18% net income growth seen by Adobe over the past five years. growth
As a next step, we compared Adobe's net income growth with the industry and found that the company has a similar growth figure when compared with the industry average growth rate of 21% in the same period.
The basis for attaching value to a company is, to a great extent, tied to its earnings growth. It’s important for an investor to know whether the market has priced in the company's expected earnings growth (or decline). By doing so, they will have an idea if the stock is headed into clear blue waters or if swampy waters await. What is ADBE worth today? The intrinsic value infographic in our free research report helps visualize whether ADBE is currently mispriced by the market.
Is Adobe Using Its Retained Earnings Effectively?
Given that Adobe doesn't pay any dividend to its shareholders, we infer that the company has been reinvesting all of its profits to grow its business.
Summary
On the whole, we feel that Adobe's performance has been quite good. Specifically, we like that the company is reinvesting a huge chunk of its profits at a high rate of return. This of course has caused the company to see substantial growth in its earnings. Having said that, the company's earnings growth is expected to slow down, as forecasted in the current analyst estimates. Are these analysts expectations based on the broad expectations for the industry, or on the company's fundamentals? Click here to be taken to our analyst's forecasts page for the company.
Have feedback on this article? Concerned about the content? Get in touch with us directly. Alternatively, email editorial-team (at) simplywallst.com.
This article by Simply Wall St is general in nature. We provide commentary based on historical data and analyst forecasts only using an unbiased methodology and our articles are not intended to be financial advice. It does not constitute a recommendation to buy or sell any stock, and does not take account of your objectives, or your financial situation. We aim to bring you long-term focused analysis driven by fundamental data. Note that our analysis may not factor in the latest price-sensitive company announcements or qualitative material. Simply Wall St has no position in any stocks mentioned.
Join A Paid User Research Session
You’ll receive a US$30 Amazon Gift card for 1 hour of your time while helping us build better investing tools for the individual investors like yourself. Sign up here
