
 Yahoo Finance
 Is Agilent Technologies' (NYSE:A) Share Price Gain Of 222% Well Earned?
When you buy a stock there is always a possibility that it could drop 100%. But on the bright side, if you buy shares in a high quality company at the right price, you can gain well over 100%. Long term Agilent Technologies, Inc. (NYSE:A) shareholders would be well aware of this, since the stock is up 222% in five years. And in the last month, the share price has gained 3.3%. But this could be related to good market conditions -- stocks in its market are up 4.1% in the last month.
Check out our latest analysis for Agilent Technologies
There is no denying that markets are sometimes efficient, but prices do not always reflect underlying business performance. One imperfect but simple way to consider how the market perception of a company has shifted is to compare the change in the earnings per share (EPS) with the share price movement.
Over half a decade, Agilent Technologies managed to grow its earnings per share at 13% a year. This EPS growth is lower than the 26% average annual increase in the share price. So it's fair to assume the market has a higher opinion of the business than it did five years ago. And that's hardly shocking given the track record of growth. This optimism is visible in its fairly high P/E ratio of 50.16.
The graphic below depicts how EPS has changed over time (unveil the exact values by clicking on the image).
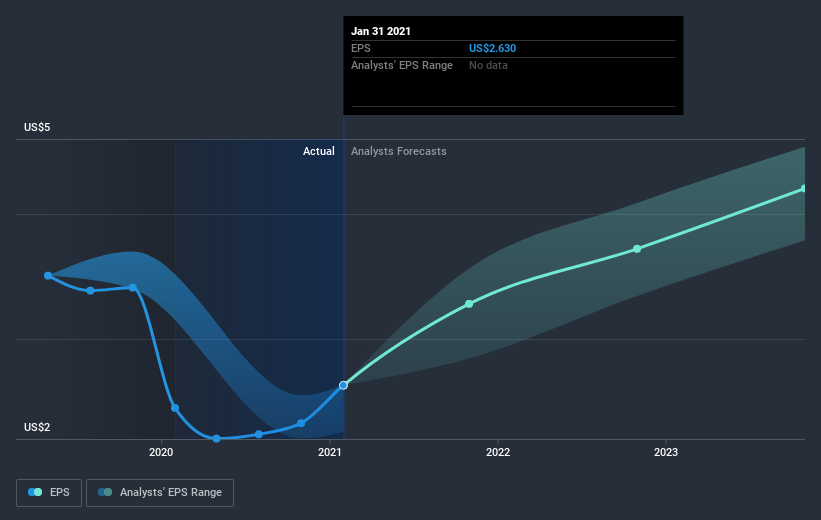
We know that Agilent Technologies has improved its bottom line over the last three years, but what does the future have in store? This free interactive report on Agilent Technologies' balance sheet strength is a great place to start, if you want to investigate the stock further.
What About Dividends?
As well as measuring the share price return, investors should also consider the total shareholder return (TSR). The TSR incorporates the value of any spin-offs or discounted capital raisings, along with any dividends, based on the assumption that the dividends are reinvested. Arguably, the TSR gives a more comprehensive picture of the return generated by a stock. As it happens, Agilent Technologies' TSR for the last 5 years was 237%, which exceeds the share price return mentioned earlier. The dividends paid by the company have thusly boosted the total shareholder return.
A Different Perspective
It's good to see that Agilent Technologies has rewarded shareholders with a total shareholder return of 70% in the last twelve months. That's including the dividend. That gain is better than the annual TSR over five years, which is 28%. Therefore it seems like sentiment around the company has been positive lately. In the best case scenario, this may hint at some real business momentum, implying that now could be a great time to delve deeper. It's always interesting to track share price performance over the longer term. But to understand Agilent Technologies better, we need to consider many other factors. Take risks, for example - Agilent Technologies has 2 warning signs we think you should be aware of.
Of course, you might find a fantastic investment by looking elsewhere. So take a peek at this free list of companies we expect will grow earnings.
Please note, the market returns quoted in this article reflect the market weighted average returns of stocks that currently trade on US exchanges.
This article by Simply Wall St is general in nature. It does not constitute a recommendation to buy or sell any stock, and does not take account of your objectives, or your financial situation. We aim to bring you long-term focused analysis driven by fundamental data. Note that our analysis may not factor in the latest price-sensitive company announcements or qualitative material. Simply Wall St has no position in any stocks mentioned.
Have feedback on this article? Concerned about the content? Get in touch with us directly. Alternatively, email editorial-team (at) simplywallst.com.
