
 Yahoo Finance
 Go-Ahead Group (LON:GOG) Might Be Having Difficulty Using Its Capital Effectively
If you're not sure where to start when looking for the next multi-bagger, there are a few key trends you should keep an eye out for. One common approach is to try and find a company with returns on capital employed (ROCE) that are increasing, in conjunction with a growing amount of capital employed. This shows us that it's a compounding machine, able to continually reinvest its earnings back into the business and generate higher returns. In light of that, when we looked at Go-Ahead Group (LON:GOG) and its ROCE trend, we weren't exactly thrilled.
Return On Capital Employed (ROCE): What is it?
If you haven't worked with ROCE before, it measures the 'return' (pre-tax profit) a company generates from capital employed in its business. To calculate this metric for Go-Ahead Group, this is the formula:
Return on Capital Employed = Earnings Before Interest and Tax (EBIT) ÷ (Total Assets - Current Liabilities)
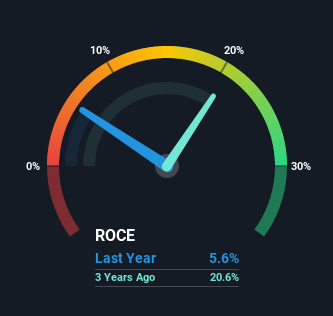
0.056 = UK£47m ÷ (UK£2.0b - UK£1.2b) (Based on the trailing twelve months to January 2021).
Therefore, Go-Ahead Group has an ROCE of 5.6%. In absolute terms, that's a low return but it's around the Transportation industry average of 6.6%.
Check out our latest analysis for Go-Ahead Group
Above you can see how the current ROCE for Go-Ahead Group compares to its prior returns on capital, but there's only so much you can tell from the past. If you'd like to see what analysts are forecasting going forward, you should check out our free report for Go-Ahead Group.
So How Is Go-Ahead Group's ROCE Trending?
When we looked at the ROCE trend at Go-Ahead Group, we didn't gain much confidence. Over the last five years, returns on capital have decreased to 5.6% from 23% five years ago. On the other hand, the company has been employing more capital without a corresponding improvement in sales in the last year, which could suggest these investments are longer term plays. It may take some time before the company starts to see any change in earnings from these investments.
On a side note, Go-Ahead Group's current liabilities are still rather high at 58% of total assets. This effectively means that suppliers (or short-term creditors) are funding a large portion of the business, so just be aware that this can introduce some elements of risk. Ideally we'd like to see this reduce as that would mean fewer obligations bearing risks.
The Bottom Line
In summary, Go-Ahead Group is reinvesting funds back into the business for growth but unfortunately it looks like sales haven't increased much just yet. And in the last five years, the stock has given away 26% so the market doesn't look too hopeful on these trends strengthening any time soon. Therefore based on the analysis done in this article, we don't think Go-Ahead Group has the makings of a multi-bagger.
If you'd like to know about the risks facing Go-Ahead Group, we've discovered 1 warning sign that you should be aware of.
While Go-Ahead Group may not currently earn the highest returns, we've compiled a list of companies that currently earn more than 25% return on equity. Check out this free list here.
This article by Simply Wall St is general in nature. It does not constitute a recommendation to buy or sell any stock, and does not take account of your objectives, or your financial situation. We aim to bring you long-term focused analysis driven by fundamental data. Note that our analysis may not factor in the latest price-sensitive company announcements or qualitative material. Simply Wall St has no position in any stocks mentioned.
Have feedback on this article? Concerned about the content? Get in touch with us directly. Alternatively, email editorial-team (at) simplywallst.com.
