
 Yahoo Finance
 Akamai Technologies (NASDAQ:AKAM) investors are sitting on a loss of 23% if they invested three years ago
In order to justify the effort of selecting individual stocks, it's worth striving to beat the returns from a market index fund. But in any portfolio, there are likely to be some stocks that fall short of that benchmark. We regret to report that long term Akamai Technologies, Inc. (NASDAQ:AKAM) shareholders have had that experience, with the share price dropping 23% in three years, versus a market return of about 19%. Shareholders have had an even rougher run lately, with the share price down 17% in the last 90 days.
So let's have a look and see if the longer term performance of the company has been in line with the underlying business' progress.
See our latest analysis for Akamai Technologies
While markets are a powerful pricing mechanism, share prices reflect investor sentiment, not just underlying business performance. One flawed but reasonable way to assess how sentiment around a company has changed is to compare the earnings per share (EPS) with the share price.
Although the share price is down over three years, Akamai Technologies actually managed to grow EPS by 4.3% per year in that time. Given the share price reaction, one might suspect that EPS is not a good guide to the business performance during the period (perhaps due to a one-off loss or gain). Alternatively, growth expectations may have been unreasonable in the past.
It's pretty reasonable to suspect the market was previously to bullish on the stock, and has since moderated expectations. Looking to other metrics might better explain the share price change.
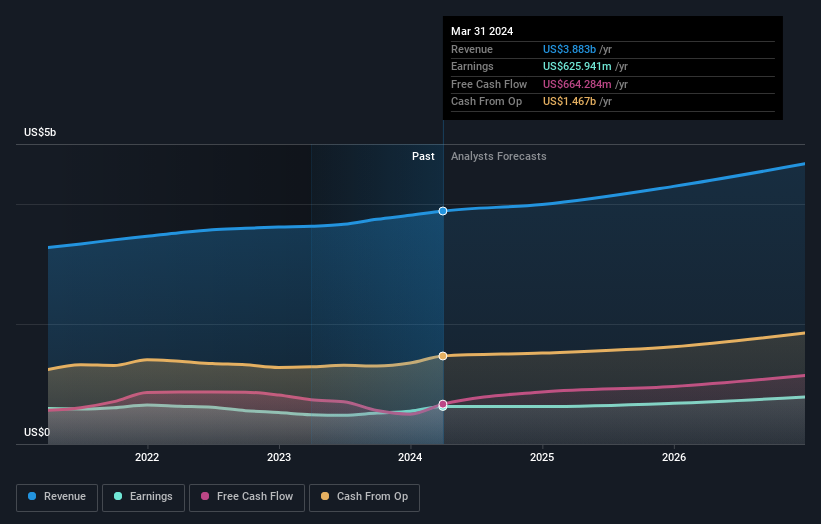
We note that, in three years, revenue has actually grown at a 5.1% annual rate, so that doesn't seem to be a reason to sell shares. This analysis is just perfunctory, but it might be worth researching Akamai Technologies more closely, as sometimes stocks fall unfairly. This could present an opportunity.
You can see below how earnings and revenue have changed over time (discover the exact values by clicking on the image).
It's good to see that there was some significant insider buying in the last three months. That's a positive. On the other hand, we think the revenue and earnings trends are much more meaningful measures of the business. This free report showing analyst forecasts should help you form a view on Akamai Technologies
A Different Perspective
Akamai Technologies provided a TSR of 0.8% over the last twelve months. Unfortunately this falls short of the market return. It's probably a good sign that the company has an even better long term track record, having provided shareholders with an annual TSR of 2% over five years. Maybe the share price is just taking a breather while the business executes on its growth strategy. It's always interesting to track share price performance over the longer term. But to understand Akamai Technologies better, we need to consider many other factors. Take risks, for example - Akamai Technologies has 1 warning sign we think you should be aware of.
There are plenty of other companies that have insiders buying up shares. You probably do not want to miss this free list of undervalued small cap companies that insiders are buying.
Please note, the market returns quoted in this article reflect the market weighted average returns of stocks that currently trade on American exchanges.
Have feedback on this article? Concerned about the content? Get in touch with us directly. Alternatively, email editorial-team (at) simplywallst.com.
This article by Simply Wall St is general in nature. We provide commentary based on historical data and analyst forecasts only using an unbiased methodology and our articles are not intended to be financial advice. It does not constitute a recommendation to buy or sell any stock, and does not take account of your objectives, or your financial situation. We aim to bring you long-term focused analysis driven by fundamental data. Note that our analysis may not factor in the latest price-sensitive company announcements or qualitative material. Simply Wall St has no position in any stocks mentioned.
Have feedback on this article? Concerned about the content? Get in touch with us directly. Alternatively, email editorial-team@simplywallst.com

