
 Yahoo Finance
 Alliance Healthcare Group (Catalist:MIJ) Is Reinvesting At Lower Rates Of Return
What trends should we look for it we want to identify stocks that can multiply in value over the long term? Amongst other things, we'll want to see two things; firstly, a growing return on capital employed (ROCE) and secondly, an expansion in the company's amount of capital employed. If you see this, it typically means it's a company with a great business model and plenty of profitable reinvestment opportunities. However, after briefly looking over the numbers, we don't think Alliance Healthcare Group (Catalist:MIJ) has the makings of a multi-bagger going forward, but let's have a look at why that may be.
Understanding Return On Capital Employed (ROCE)
If you haven't worked with ROCE before, it measures the 'return' (pre-tax profit) a company generates from capital employed in its business. To calculate this metric for Alliance Healthcare Group, this is the formula:
Return on Capital Employed = Earnings Before Interest and Tax (EBIT) ÷ (Total Assets - Current Liabilities)
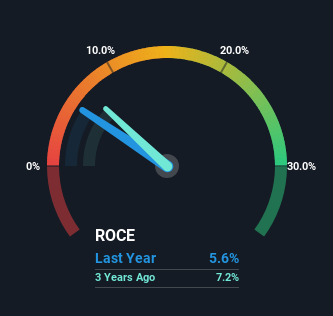
0.056 = S$2.0m ÷ (S$74m - S$37m) (Based on the trailing twelve months to December 2023).
Therefore, Alliance Healthcare Group has an ROCE of 5.6%. In absolute terms, that's a low return and it also under-performs the Healthcare industry average of 7.0%.
See our latest analysis for Alliance Healthcare Group
While the past is not representative of the future, it can be helpful to know how a company has performed historically, which is why we have this chart above. If you want to delve into the historical earnings , check out these free graphs detailing revenue and cash flow performance of Alliance Healthcare Group.
What Can We Tell From Alliance Healthcare Group's ROCE Trend?
When we looked at the ROCE trend at Alliance Healthcare Group, we didn't gain much confidence. To be more specific, ROCE has fallen from 18% over the last five years. However, given capital employed and revenue have both increased it appears that the business is currently pursuing growth, at the consequence of short term returns. And if the increased capital generates additional returns, the business, and thus shareholders, will benefit in the long run.
Another thing to note, Alliance Healthcare Group has a high ratio of current liabilities to total assets of 51%. This can bring about some risks because the company is basically operating with a rather large reliance on its suppliers or other sorts of short-term creditors. While it's not necessarily a bad thing, it can be beneficial if this ratio is lower.
The Bottom Line
While returns have fallen for Alliance Healthcare Group in recent times, we're encouraged to see that sales are growing and that the business is reinvesting in its operations. These growth trends haven't led to growth returns though, since the stock has fallen 23% over the last three years. So we think it'd be worthwhile to look further into this stock given the trends look encouraging.
Since virtually every company faces some risks, it's worth knowing what they are, and we've spotted 3 warning signs for Alliance Healthcare Group (of which 1 is concerning!) that you should know about.
If you want to search for solid companies with great earnings, check out this free list of companies with good balance sheets and impressive returns on equity.
Have feedback on this article? Concerned about the content? Get in touch with us directly. Alternatively, email editorial-team (at) simplywallst.com.
This article by Simply Wall St is general in nature. We provide commentary based on historical data and analyst forecasts only using an unbiased methodology and our articles are not intended to be financial advice. It does not constitute a recommendation to buy or sell any stock, and does not take account of your objectives, or your financial situation. We aim to bring you long-term focused analysis driven by fundamental data. Note that our analysis may not factor in the latest price-sensitive company announcements or qualitative material. Simply Wall St has no position in any stocks mentioned.
