
 Yahoo Finance
 Allstate (ALL) Q1 Loss Narrower Than Expected, Revenues Rise
The Allstate Corporation ALL incurred a first-quarter 2023 adjusted loss of $1.30 per share, narrower than the Zacks Consensus Estimate of a loss of $1.94 per share. Notably, earnings of $2.59 per share were reported in the prior-year quarter.
The quarterly results took a hit from significant catastrophe losses, escalating expenses and lower contributions from the Protection Services, and Health and Benefits segments.
ALL’s operating revenues increased 9.3% year over year to $13,772 million in the quarter under review. The top line outpaced the consensus mark by 7.4%. This was mainly due to rate increases in auto and home insurance leading to 10.8% year-over-year growth in property and casualty (P&C) insurance premiums.
The Allstate Corporation Price, Consensus and EPS Surprise
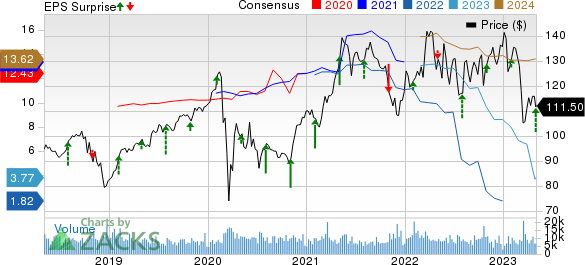
The Allstate Corporation price-consensus-eps-surprise-chart | The Allstate Corporation Quote
Q1 Operations
Net investment income of $575 million fell 3.2% year over year due to a significant plunge of 58.8% in performance-based investment income. The figure, however, surpassed our estimate of $501.9 million. Market-based investment income soared 57% year over year in the first quarter.
Total costs and expenses of $14,192 million escalated 23% year over year mainly due to higher P&C insurance claims and claim expenses, and the amortization of deferred policy acquisition costs.
Allstate incurred a pretax loss of $406 million in the quarter under review against the prior-year quarter’s pretax income of $801 million.
Total policies in force fell 1.9% year over year to 186.7 million as of Mar 31, 2023.
ALL’s catastrophe losses were $1,691 million, which increased nearly four-fold year over year.
Segmental Performances
The Property-Liability segment’s premiums grew 10.8% year over year to $11,635 million in the first quarter, thanks to higher average premiums from Allstate and National General brands. The reported figure beat the Zacks Consensus Estimate of $11,508 million.
The segment incurred an underwriting loss of $1,001 million against the prior-year quarter’s underwriting income of $280 million. The underwriting loss stemmed from an elevated catastrophe loss level. The underlying combined ratio of 93.3% deteriorated 240 basis points (bps) year over year in the quarter under review.
The Protection Services segment reported revenues of $671 million, which rose 7% year over year in the first quarter on the back of higher revenues derived from Allstate Protection Plans and Allstate Dealer Services. Adjusted net income dropped 19% year over year to $34 million, lower than the consensus mark of $46.2 million and our estimate of $42 million.
The Allstate Health and Benefits segment’s total premium and contract charges of $463 million dipped 1.1% year over year in the quarter under review but outpaced the Zacks Consensus Estimate of $460 million. Softness in individual health and employer voluntary benefits exerted a strain on the metric. Adjusted net income of $56 million slid 1.8% year over year and matched the consensus mark.
Financial Update (as of Mar 31, 2023)
Allstate exited the first quarter with a cash balance of $662 million, which tumbled 10.1% from the 2022-end level. Total assets of $99.6 billion increased 1.7% from the figure at 2022 end.
Debt amounted to $8,452 million, up 6.1% from the figure as of Dec 31, 2022. Total shareholders’ equity of $17,494 million inched up marginally from the 2022-end level.
Book value per common share came in at $58.65, which plunged 22.3% year over year.
The adjusted net income return on equity in the trailing 12-month period came in at a negative figure of 6.7%. The metric was recorded at 13% in the prior-year quarter.
Capital Deployment
In the reported quarter, Allstate rewarded its shareholders with $377 million, which included share buybacks worth $153 million and dividends of $224 million.
Zacks Rank
Allstate currently carries a Zacks Rank #3 (Hold). You can see the complete list of today’s Zacks #1 Rank (Strong Buy) stocks here.
Performance of Other Insurers
Of the other insurance industry players that have reported first-quarter 2023 results so far, the bottom-line results of Kinsale Capital Group, Inc. KNSL, Cincinnati Financial Corporation CINF and Aflac Incorporated AFL beat the Zacks Consensus Estimate.
Kinsale Capital delivered first-quarter 2023 net operating earnings of $2.44 per share, which outpaced the Zacks Consensus Estimate by 8.9% and our estimate of earnings of $2.20 per share. The bottom line improved 49.7% year over year. Total revenues amounted to $256.9 million, surpassing the Zacks Consensus Estimate by 3.2% and our estimate of $242.1 million. The metric rose 42.8% year over year in the quarter under review.
Net written premiums climbed 38.1% year over year to $299 million in the quarter. The net investment income of KNSL increased 127.7% to $20.7 million in the quarter. Underwriting income of $51.6 million improved 37.5% year over year, while the combined ratio improved 80 bps to 78.2.
Cincinnati Financial reported a first-quarter 2023 operating income of 89 cents per share, which beat the Zacks Consensus Estimate by 30.9% and our estimate of 61 cents per share. However, the bottom line decreased 43.7% year over year. Total operating revenues in the quarter under review were $2,135 million, which beat the Zacks Consensus Estimate by 5.4% and our estimate of $1,820.8 million. The top line improved 13.5% year over year.
Net written premiums of CINF climbed 6% year over year to $2,019 million. Investment income, net of expenses, increased 14% year over year to $210 million. The combined ratio deteriorated 1080 bps year over year to 100.7%.
Aflac reported first-quarter 2023 adjusted earnings per share of $1.55, which beat the Zacks Consensus Estimate by 12.3% and our estimate by 17.4%. The bottom line increased 7.6% year over year. AFL’s revenues dropped 7.2% year over year to $4,800 million in the quarter under review. The top line beat the consensus mark by 4.4% and our estimate by 6%.
Adjusted net investment income fell 3.9% year over year to $845 million. Adjusted revenues in the Aflac U.S. segment climbed 1.3% year over year, while the same for the Aflac Japan unit decreased 15.8% year over year.
Want the latest recommendations from Zacks Investment Research? Today, you can download 7 Best Stocks for the Next 30 Days. Click to get this free report
Aflac Incorporated (AFL) : Free Stock Analysis Report
Cincinnati Financial Corporation (CINF) : Free Stock Analysis Report
The Allstate Corporation (ALL) : Free Stock Analysis Report
Kinsale Capital Group, Inc. (KNSL) : Free Stock Analysis Report
