
 Yahoo Finance
 Is Alphabet Inc.'s (NASDAQ:GOOGL) Stock's Recent Performance Being Led By Its Attractive Financial Prospects?
Most readers would already be aware that Alphabet's (NASDAQ:GOOGL) stock increased significantly by 24% over the past three months. Since the market usually pay for a company’s long-term fundamentals, we decided to study the company’s key performance indicators to see if they could be influencing the market. Specifically, we decided to study Alphabet's ROE in this article.
Return on equity or ROE is an important factor to be considered by a shareholder because it tells them how effectively their capital is being reinvested. Put another way, it reveals the company's success at turning shareholder investments into profits.
Check out our latest analysis for Alphabet
How Do You Calculate Return On Equity?
Return on equity can be calculated by using the formula:
Return on Equity = Net Profit (from continuing operations) ÷ Shareholders' Equity
So, based on the above formula, the ROE for Alphabet is:
28% = US$82b ÷ US$293b (Based on the trailing twelve months to March 2024).
The 'return' is the amount earned after tax over the last twelve months. Another way to think of that is that for every $1 worth of equity, the company was able to earn $0.28 in profit.
What Has ROE Got To Do With Earnings Growth?
So far, we've learned that ROE is a measure of a company's profitability. Based on how much of its profits the company chooses to reinvest or "retain", we are then able to evaluate a company's future ability to generate profits. Assuming everything else remains unchanged, the higher the ROE and profit retention, the higher the growth rate of a company compared to companies that don't necessarily bear these characteristics.
Alphabet's Earnings Growth And 28% ROE
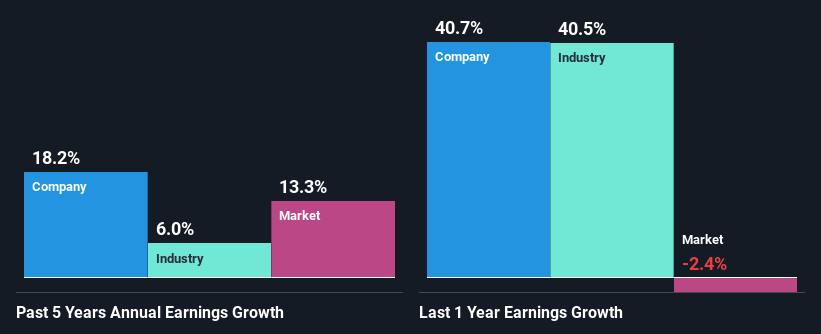
First thing first, we like that Alphabet has an impressive ROE. Additionally, the company's ROE is higher compared to the industry average of 7.4% which is quite remarkable. This probably laid the groundwork for Alphabet's moderate 18% net income growth seen over the past five years.
As a next step, we compared Alphabet's net income growth with the industry, and pleasingly, we found that the growth seen by the company is higher than the average industry growth of 6.0%.
The basis for attaching value to a company is, to a great extent, tied to its earnings growth. The investor should try to establish if the expected growth or decline in earnings, whichever the case may be, is priced in. This then helps them determine if the stock is placed for a bright or bleak future. Has the market priced in the future outlook for GOOGL? You can find out in our latest intrinsic value infographic research report.
Is Alphabet Efficiently Re-investing Its Profits?
Summary
Overall, we are quite pleased with Alphabet's performance. In particular, it's great to see that the company is investing heavily into its business and along with a high rate of return, that has resulted in a sizeable growth in its earnings. With that said, the latest industry analyst forecasts reveal that the company's earnings growth is expected to slow down. Are these analysts expectations based on the broad expectations for the industry, or on the company's fundamentals? Click here to be taken to our analyst's forecasts page for the company.
Have feedback on this article? Concerned about the content? Get in touch with us directly. Alternatively, email editorial-team (at) simplywallst.com.
This article by Simply Wall St is general in nature. We provide commentary based on historical data and analyst forecasts only using an unbiased methodology and our articles are not intended to be financial advice. It does not constitute a recommendation to buy or sell any stock, and does not take account of your objectives, or your financial situation. We aim to bring you long-term focused analysis driven by fundamental data. Note that our analysis may not factor in the latest price-sensitive company announcements or qualitative material. Simply Wall St has no position in any stocks mentioned.
Have feedback on this article? Concerned about the content? Get in touch with us directly. Alternatively, email editorial-team@simplywallst.com
