
 Yahoo Finance
 The Alumasc Group (LON:ALU) Share Price Is Down 40% So Some Shareholders Are Getting Worried
Want to participate in a research study? Help shape the future of investing tools and earn a $60 gift card!
For many investors, the main point of stock picking is to generate higher returns than the overall market. But if you try your hand at stock picking, your risk returning less than the market. We regret to report that long term The Alumasc Group plc (LON:ALU) shareholders have had that experience, with the share price dropping 40% in three years, versus a market return of about 33%. Unfortunately the share price momentum is still quite negative, with prices down 9.7% in thirty days.
See our latest analysis for Alumasc Group
To paraphrase Benjamin Graham: Over the short term the market is a voting machine, but over the long term it's a weighing machine. One imperfect but simple way to consider how the market perception of a company has shifted is to compare the change in the earnings per share (EPS) with the share price movement.
During the three years that the share price fell, Alumasc Group's earnings per share (EPS) dropped by 26% each year. In comparison the 16% compound annual share price decline isn't as bad as the EPS drop-off. This suggests that the market retains some optimism around long term earnings stability, despite past EPS declines.
The graphic below depicts how EPS has changed over time (unveil the exact values by clicking on the image).
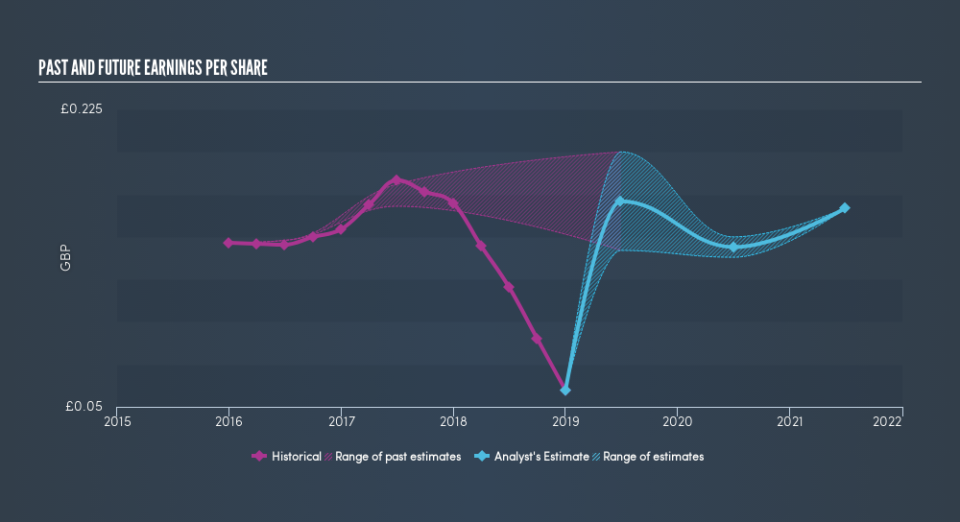
It might be well worthwhile taking a look at our free report on Alumasc Group's earnings, revenue and cash flow.
What About Dividends?
As well as measuring the share price return, investors should also consider the total shareholder return (TSR). The TSR is a return calculation that accounts for the value of cash dividends (assuming that any dividend received was reinvested) and the calculated value of any discounted capital raisings and spin-offs. Arguably, the TSR gives a more comprehensive picture of the return generated by a stock. As it happens, Alumasc Group's TSR for the last 3 years was -31%, which exceeds the share price return mentioned earlier. And there's no prize for guessing that the dividend payments largely explain the divergence!
A Different Perspective
Investors in Alumasc Group had a tough year, with a total loss of 14% (including dividends), against a market gain of about 8.0%. Even the share prices of good stocks drop sometimes, but we want to see improvements in the fundamental metrics of a business, before getting too interested. Longer term investors wouldn't be so upset, since they would have made 0.4%, each year, over five years. If the fundamental data continues to indicate long term sustainable growth, the current sell-off could be an opportunity worth considering. If you would like to research Alumasc Group in more detail then you might want to take a look at whether insiders have been buying or selling shares in the company.
If you like to buy stocks alongside management, then you might just love this free list of companies. (Hint: insiders have been buying them).
Please note, the market returns quoted in this article reflect the market weighted average returns of stocks that currently trade on GB exchanges.
We aim to bring you long-term focused research analysis driven by fundamental data. Note that our analysis may not factor in the latest price-sensitive company announcements or qualitative material.
If you spot an error that warrants correction, please contact the editor at editorial-team@simplywallst.com. This article by Simply Wall St is general in nature. It does not constitute a recommendation to buy or sell any stock, and does not take account of your objectives, or your financial situation. Simply Wall St has no position in the stocks mentioned. Thank you for reading.
