
 Yahoo Finance
 Anhui Conch Cement Co Ltd's Dividend Analysis
Assessing the Sustainability and Growth of Dividends
Anhui Conch Cement Co Ltd (AHCHY) recently announced a dividend of $0.67 per share, payable on 2024-07-18, with the ex-dividend date set for 2024-06-04. As investors look forward to this upcoming payment, the spotlight also shines on the company's dividend history, yield, and growth rates. Using the data from GuruFocus, let's look into Anhui Conch Cement Co Ltd's dividend performance and assess its sustainability.
What Does Anhui Conch Cement Co Ltd Do?
This Powerful Chart Made Peter Lynch 29% A Year For 13 Years
How to calculate the intrinsic value of a stock?
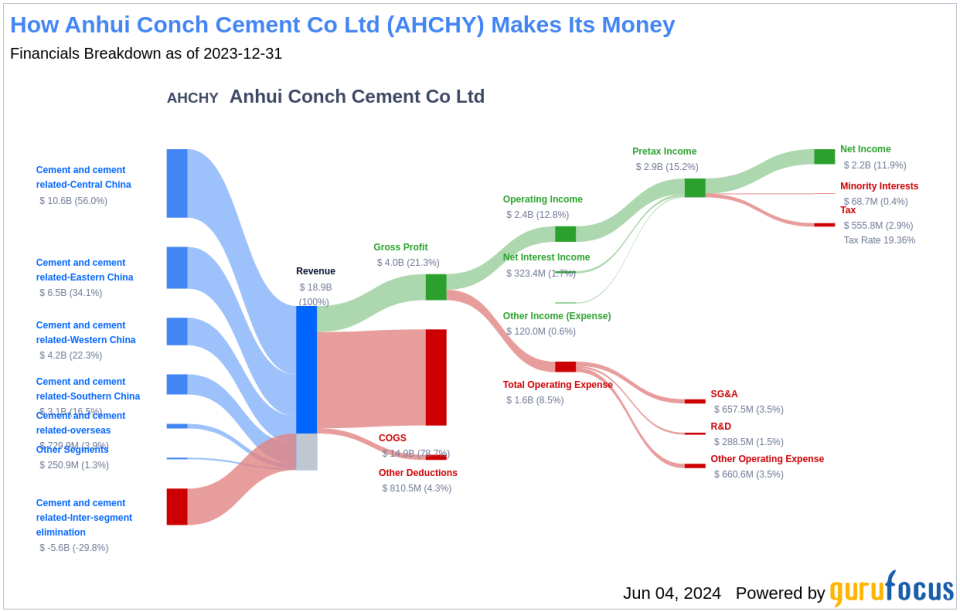
Anhui Conch Cement is mainly engaged in the production and sale of cement and clinker. The company was established in 1997 and headquartered in Anhui province. With an annual cement production capacity of 395 million metric tons in 2023, the firm is the second-largest cement manufacturer in China. Sales of self-produced products contributed about 59.6% of its 2023 revenue, with the remainder mainly from the trading business and service income.
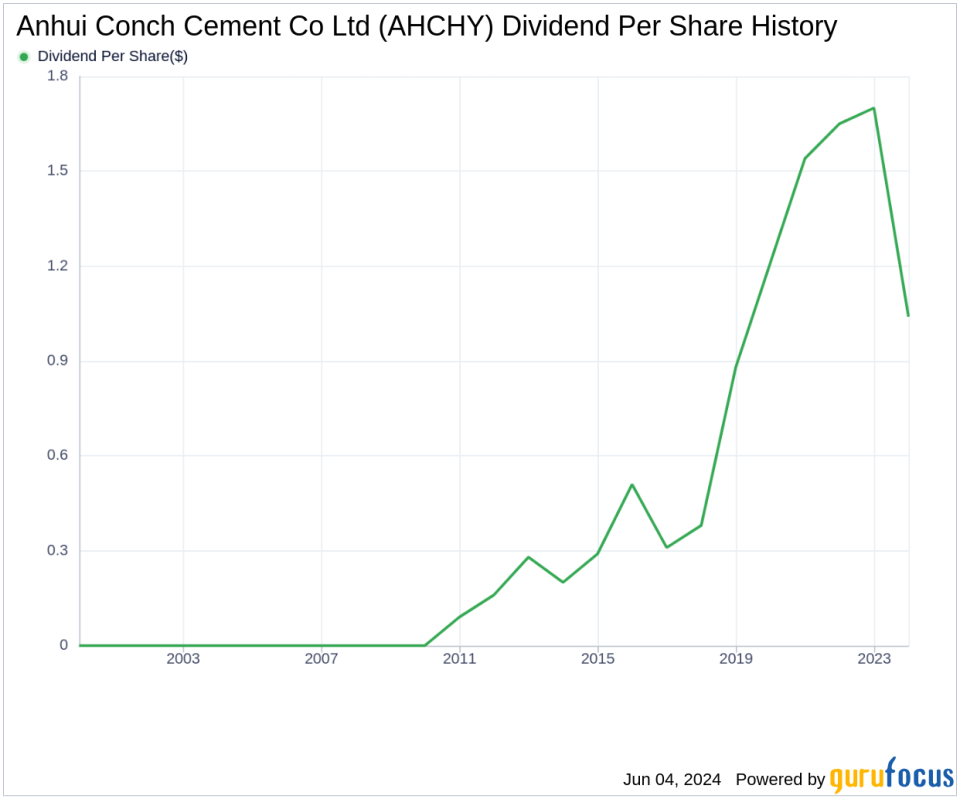
A Glimpse at Anhui Conch Cement Co Ltd's Dividend History
Anhui Conch Cement Co Ltd has maintained a consistent dividend payment record since 2010. Dividends are currently distributed on a yearly basis. Below is a chart showing annual Dividends Per Share for tracking historical trends.
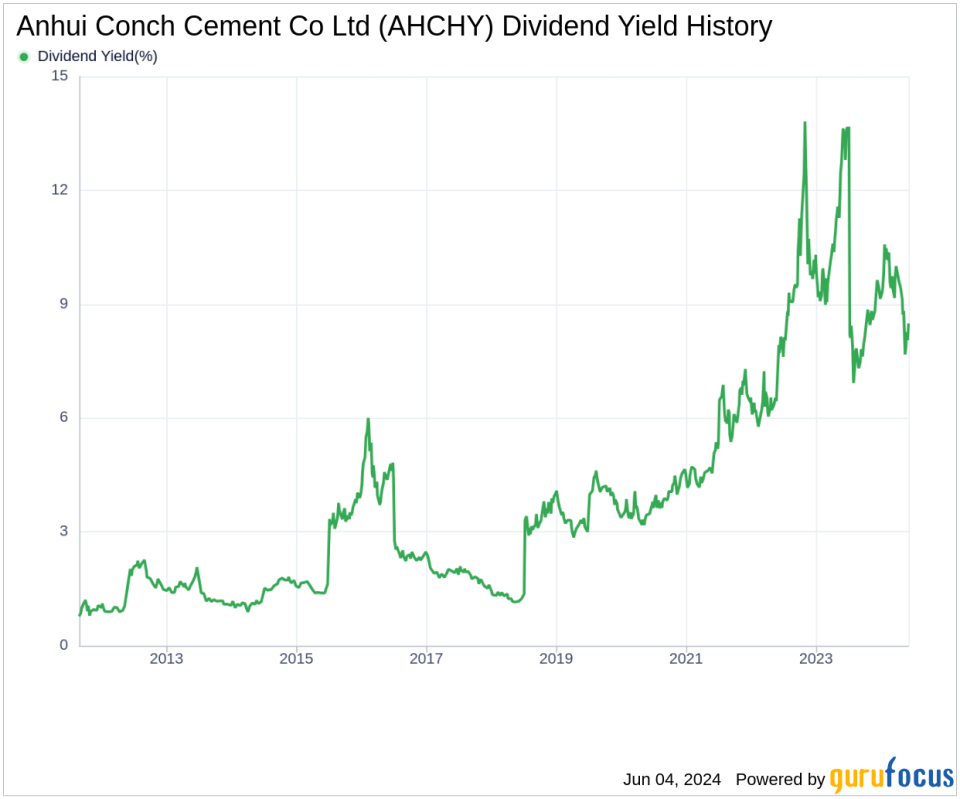
Breaking Down Anhui Conch Cement Co Ltd's Dividend Yield and Growth
As of today, Anhui Conch Cement Co Ltd currently has a 12-month trailing dividend yield of 8.48% and a 12-month forward dividend yield of 5.41%, suggesting an expectation of decreased dividend payments over the next 12 months. Over the past three years, Anhui Conch Cement Co Ltd's annual dividend growth rate was -9.50%. Extended to a five-year horizon, this rate increased to 6.30% per year. Over the past decade, Anhui Conch Cement Co Ltd's annual dividends per share growth rate stands at an impressive 24.80%.
Based on Anhui Conch Cement Co Ltd's dividend yield and five-year growth rate, the 5-year yield on cost of Anhui Conch Cement Co Ltd stock as of today is approximately 11.51%.
The Sustainability Question: Payout Ratio and Profitability
To assess the sustainability of the dividend, one needs to evaluate the company's payout ratio. The dividend payout ratio provides insights into the portion of earnings the company distributes as dividends. A lower ratio suggests that the company retains a significant part of its earnings, thereby ensuring the availability of funds for future growth and unexpected downturns. As of 2024-03-31, Anhui Conch Cement Co Ltd's dividend payout ratio is 0.80, which may suggest that the company's dividend may not be sustainable.
Anhui Conch Cement Co Ltd's profitability rank, offers an understanding of the company's earnings prowess relative to its peers. GuruFocus ranks Anhui Conch Cement Co Ltd's profitability 7 out of 10 as of 2024-03-31, suggesting good profitability prospects. The company has reported positive net income for each year over the past decade, further solidifying its high profitability.
Growth Metrics: The Future Outlook
To ensure the sustainability of dividends, a company must have robust growth metrics. Anhui Conch Cement Co Ltd's growth rank of 7 out of 10 suggests that the company's growth trajectory is good relative to its competitors.
Revenue is the lifeblood of any company, and Anhui Conch Cement Co Ltd's revenue per share, combined with the 3-year revenue growth rate, indicates a strong revenue model. Anhui Conch Cement Co Ltd's revenue has increased by approximately -7.10% per year on average, a rate that underperforms than approximately 83.11% of global competitors.
The company's 3-year EPS growth rate showcases its capability to grow its earnings, a critical component for sustaining dividends in the long run. During the past three years, Anhui Conch Cement Co Ltd's earnings increased by approximately -33.00% per year on average, a rate that underperforms than approximately 88.38% of global competitors.
Lastly, the company's 5-year EBITDA growth rate of -20.10%, which underperforms than approximately 87.19% of global competitors.
Next Steps
Considering Anhui Conch Cement Co Ltd's dividend payments, growth rate, payout ratio, profitability, and growth metrics, investors should carefully evaluate the sustainability of future dividends. While the company maintains a strong profitability rank, the declining growth metrics and high payout ratio could pose challenges to sustaining its dividend payments at current levels. GuruFocus Premium users can screen for high-dividend yield stocks using the High Dividend Yield Screener.
This article, generated by GuruFocus, is designed to provide general insights and is not tailored financial advice. Our commentary is rooted in historical data and analyst projections, utilizing an impartial methodology, and is not intended to serve as specific investment guidance. It does not formulate a recommendation to purchase or divest any stock and does not consider individual investment objectives or financial circumstances. Our objective is to deliver long-term, fundamental data-driven analysis. Be aware that our analysis might not incorporate the most recent, price-sensitive company announcements or qualitative information. GuruFocus holds no position in the stocks mentioned herein.
This article first appeared on GuruFocus.
