
 Yahoo Finance
 Are ASSA ABLOY AB (publ)’s Returns On Capital Worth Investigating?

Today we'll look at ASSA ABLOY AB (publ) (STO:ASSA B) and reflect on its potential as an investment. Specifically, we'll consider its Return On Capital Employed (ROCE), since that will give us an insight into how efficiently the business can generate profits from the capital it requires.
First, we'll go over how we calculate ROCE. Second, we'll look at its ROCE compared to similar companies. Last but not least, we'll look at what impact its current liabilities have on its ROCE.
Return On Capital Employed (ROCE): What is it?
ROCE is a metric for evaluating how much pre-tax income (in percentage terms) a company earns on the capital invested in its business. All else being equal, a better business will have a higher ROCE. Ultimately, it is a useful but imperfect metric. Renowned investment researcher Michael Mauboussin has suggested that a high ROCE can indicate that 'one dollar invested in the company generates value of more than one dollar'.
How Do You Calculate Return On Capital Employed?
The formula for calculating the return on capital employed is:
Return on Capital Employed = Earnings Before Interest and Tax (EBIT) ÷ (Total Assets - Current Liabilities)
Or for ASSA ABLOY:
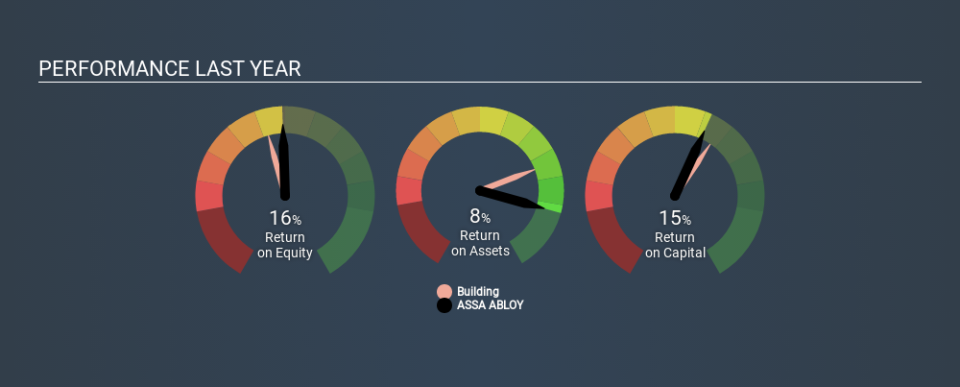
0.15 = kr13b ÷ (kr122b - kr33b) (Based on the trailing twelve months to September 2019.)
So, ASSA ABLOY has an ROCE of 15%.
View our latest analysis for ASSA ABLOY
Is ASSA ABLOY's ROCE Good?
One way to assess ROCE is to compare similar companies. We can see ASSA ABLOY's ROCE is around the 13% average reported by the Building industry. Separate from ASSA ABLOY's performance relative to its industry, its ROCE in absolute terms looks satisfactory, and it may be worth researching in more depth.
The image below shows how ASSA ABLOY's ROCE compares to its industry, and you can click it to see more detail on its past growth.
When considering this metric, keep in mind that it is backwards looking, and not necessarily predictive. ROCE can be deceptive for cyclical businesses, as returns can look incredible in boom times, and terribly low in downturns. This is because ROCE only looks at one year, instead of considering returns across a whole cycle. Future performance is what matters, and you can see analyst predictions in our free report on analyst forecasts for the company.
ASSA ABLOY's Current Liabilities And Their Impact On Its ROCE
Current liabilities are short term bills and invoices that need to be paid in 12 months or less. The ROCE equation subtracts current liabilities from capital employed, so a company with a lot of current liabilities appears to have less capital employed, and a higher ROCE than otherwise. To check the impact of this, we calculate if a company has high current liabilities relative to its total assets.
ASSA ABLOY has total liabilities of kr33b and total assets of kr122b. As a result, its current liabilities are equal to approximately 27% of its total assets. Current liabilities are minimal, limiting the impact on ROCE.
What We Can Learn From ASSA ABLOY's ROCE
This is good to see, and with a sound ROCE, ASSA ABLOY could be worth a closer look. ASSA ABLOY shapes up well under this analysis, but it is far from the only business delivering excellent numbers . You might also want to check this free collection of companies delivering excellent earnings growth.
For those who like to find winning investments this free list of growing companies with recent insider purchasing, could be just the ticket.
If you spot an error that warrants correction, please contact the editor at editorial-team@simplywallst.com. This article by Simply Wall St is general in nature. It does not constitute a recommendation to buy or sell any stock, and does not take account of your objectives, or your financial situation. Simply Wall St has no position in the stocks mentioned.
We aim to bring you long-term focused research analysis driven by fundamental data. Note that our analysis may not factor in the latest price-sensitive company announcements or qualitative material. Thank you for reading.
