
 Yahoo Finance
Atlantica Reports 2022 Financial Results

By Project Type (GW)
By Project Stage (GW)

By Source (GW)

Revenue for 2022 reached $1,102.0 million, a 2.9% increase year-over-year on a comparable basis1 and a 9.1% decrease year-over-year.
Adjusted EBITDA in 2022 was $797.1 million, a 1.5% increase year-over-year on a comparable basis1 and a 3.3% decrease year-over-year.
Net loss for 2022 attributable to the Company was $5.4 million, compared with a net loss of $30.1 million in 2021.
Net cash provided by operating activities for 2022 was $586.3 million, a 16.0% increase compared with $505.6 million in the year 2021.
Cash available for distribution (“CAFD”) increased by 5.5% year-over-year up to $237.9 million in 2022.
2023 CAFD guidance initiated in the range of $235 million to $260 million.
Attractive growth opportunities including ~$165-$185 million in investments already committed or earmarked for 2023.
March 1, 2023 – Atlantica Sustainable Infrastructure plc (NASDAQ: AY) (“Atlantica” or the “Company”) today reported its financial results for the year 2022. Revenue for 2022 was $1,102.0 million, a 9.1% decrease compared with 2021 and a 2.9% increase on a comparable basis1. Adjusted EBITDA was $797.1 million, a 3.3% decrease compared to 2021 and a 1.5% increase on a comparable basis1. Net cash provided by operating activities reached $586.3 million in 2022, a 16.0% increase compared to 2021. CAFD was $237.9 million in 2022, a 5.5% increase compared with $225.6 million in 2021. CAFD per share2 was $2.07, a 2.1% increase compared to 2021.
Highlights
| Year ended December 31, |
| ||||
| 2022 |
| 2021 |
| ||
Revenue | $ 1,102,029 |
| $ 1,211,749 |
|
| |
Profit/(loss) for the period attributable to the Company | (5,443) |
| (30,080) |
|
| |
Adjusted EBITDA | 797,100 |
| 824,388 |
|
| |
Net cash provided by operating activities | 586,322 |
| 505,623 |
|
| |
CAFD | 237,872 |
| 225,547 |
|
| |
Key Performance Indicators
| Year ended December 31, |
| ||
| 2022 |
| 2021 | |
Renewable energy |
|
|
| |
MW in operation3 | 2,121 |
| 2,044 | |
GWh produced4 | 5,319 |
| 4,655 | |
Efficient natural gas & heat |
|
|
| |
MW in operation5 | 398 |
| 398 | |
GWh produced6 | 2,501 |
| 2,292 | |
Availability (%)7 | 98.9% |
| 100.6% | |
Transmission lines |
|
|
| |
Miles in operation | 1,229 |
| 1,166 | |
Availability (%)7 | 100.0% |
| 100.0% | |
Water |
|
|
| |
Mft3 in operation3 | 17.5 |
| 17.5 | |
Availability (%)7 | 102.3% |
| 97.9% | |
Segment Results
|
| ||
| 2022 |
| 2021 |
Revenue by geography |
|
|
|
North America | $ 405,047 |
| $ 395,775 |
South America | 166,441 |
| 154,985 |
EMEA | 530,541 |
| 660,989 |
Total Revenue | $ 1,102,029 |
| $ 1,211,749 |
Adjusted EBITDA by geography |
|
|
| |
North America | $ 309,988 |
| $ 311,803 |
|
South America | 126,551 |
| 119,547 |
|
EMEA | 360,561 |
| 393,038 |
|
Total Adjusted EBITDA | $ 797,100 |
| $ 824,388 |
|
(in thousands of U.S. dollars) | Year ended December 31, | |||
| 2022 |
| 2021 |
|
Revenue by business sector |
|
|
|
|
Renewable energy | $ 821,377 |
| $ 928,525 |
|
Efficient natural gas & heat | 113,591 |
| 123,692 |
|
Transmission lines | 113,273 |
| 105,680 |
|
Water | 53,788 |
| 53,852 |
|
Total Revenue | $ 1,102,029 |
| $ 1,211,749 |
|
|
|
|
| |
Adjusted EBITDA by business sector |
|
|
| |
Renewable energy | $ 588,016 |
| $ 602,583 |
|
Efficient natural gas & heat | 84,560 |
| 99,935 |
|
Transmission lines | 88,010 |
| 83,635 |
|
Water | 36,514 |
| 38,235 |
|
Total Adjusted EBITDA | $ 797,100 |
| $ 824,388 |
|
During 2022, production in the renewable energy portfolio increased by 14.3%, a considerable increase compared with 2021 mainly thanks to the contribution from recent investments. In our solar assets in the US, production in 2022 increased due to higher solar radiation compared with 2021. Production also increased at Kaxu. On the other hand, production decreased in the year 2022 in our solar assets in Spain and in our wind assets in Uruguay, due to lower solar radiation and lower wind resource, respectively, compared to 2021.
In our efficient natural gas and heat, transmission lines and water segments, where revenue is based on availability, we maintained very high availability levels in 2022.
Liquidity and Debt
As of December 31, 2022, cash at Atlantica’s corporate level was $60.8 million, compared with $88.3 million as of December 31, 2021. Additionally, as of December 31, 2022, the Company had $385.1 million available under its Revolving Credit Facility and therefore total corporate liquidity8 of $445.9 million, compared with $528.3 million as of December 31, 2021.
As of December 31, 2022, net project debt9 was $4.01 billion, compared with $4.50 billion as of December 31, 2021, while net corporate debt10 was $956.4 million, compared with $934.8 million as of December 31, 2021. As of December 31, 2022, the net corporate debt / CAFD pre-corporate debt service ratio11 was 3.4x and the average corporate debt maturity stood at 4.2 years, providing the Company with significant financial flexibility.
Dividend
On February 28, 2023, the Board of Directors of Atlantica approved a dividend of $0.445 per share. This dividend is expected to be paid on March 25, 2023, to shareholders of record as of March 14, 2023.
ESG
Atlantica continues to be recognized internationally on the ESG front:
In November 2022, Atlantica was ranked 1st globally on GRESB's Infrastructure Public Disclosure rating.
In December 2022, Atlantica was included for the second consecutive year in the CDP “A List”, achieving the highest score on environmental transparency and action in relation to climate change.
In January 2023, Atlantica was ranked for the third consecutive year by Global 100 amongst the World's 100 Most Sustainable Corporations.
Also in January 2023, Atlantica was included for the third consecutive year in the Bloomberg Gender-Equality Index (GEI).
Finally, in February 2023, Atlantica was included for the second consecutive year in the S&P Global Sustainability Yearbook, which aims to distinguish those companies within their industries that have demonstrated strengths in corporate sustainability.
Growth Update
As of today, Atlantica has already committed or earmarked investments for 2023 in a range between $165 and $18512 million. These investments include:
The construction of Coso Batteries 1, a battery storage system developed in-house located inside our Coso geothermal plant in California, recently announced. The battery system will have a capacity of 100 MWh (4 hours) and is expected to start operation in 2024. The project, which will benefit from the U.S. Inflation Reduction Act and from synergies with existing assets in the region, will represent an expected investment in a range between $40 and $50 million.
Several solar PV assets in North America, Europe and South America, in which we expect to invest between $80 and $85 million.
The expansion of two of our transmission lines in Peru, ATN and ATS, which are expected to represent an investment in a range between $18 and $20 million.
Other investments, including storage in different geographies, for an amount in the range of $25 to $30 million.
Development Pipeline
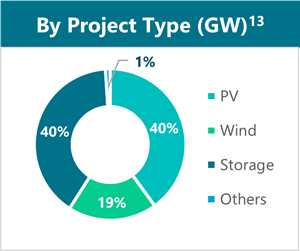
As a result of the Company’s increasing focus on growth through development and construction, we currently have a pipeline of projects under development, including both repowering and expansion opportunities of existing assets and greenfield development, of approximately 2.0 GW13 of renewable energy and 5.6 GWh13 of storage. Our pipeline consists mostly of PV, storage and wind and is mainly focused on North America. Approximately 18% of the projects are estimated to reach ready to build (“Rtb”) in 2023 or 2024 and 17% are in an advanced development stage. Our pipeline also includes our first hydrogen project, that comprises a 10 MW PV facility and has recently won a $6.5 million grant.
With this, we are confident that we can continue delivering accretive growth to our shareholders.
| Renewable Energy (GW)13 | Storage (GWh)13 |
North America | 1.0 | 4.1 |
Europe | 0.4 | 1.3 |
South America | 0.6 | 0.2 |
Total | 2.0 | 5.6 |
Please see "By Project Type (GW)", "By Project Stage (GW)" and "By Source (GW)" charts below.
2023 Guidance
Atlantica is initiating guidance for 2023:
2023 expected Adjusted EBITDA in the range of $790 million to $85014 million.
2023 expected CAFD in the range of $235 million to $260 million.
Strategic Review
On February 21, 2023, Atlantica’s board of directors commenced a process to explore and evaluate potential strategic alternatives that may be available to Atlantica to maximize shareholder value. The Company believes it has attractive growth and other opportunities in front of it and is committed to ensuring it is best positioned to take advantage of those opportunities. The decision has the support of the Company’s largest shareholder, Algonquin. Atlantica expects to continue executing on its existing plans while the review of strategic alternatives is ongoing, including its current growth plan. There is no assurance that any specific transaction will be consummated, or other strategic change will be implemented as a result of this strategic review.
Details of the Results Presentation Conference
Atlantica’s CEO, Santiago Seage and CFO, Francisco Martinez-Davis, will hold a conference call and a webcast on Wednesday, March 1, 2023, at 8:00 am (New York time).
In order to access the conference call participants should dial: + 1-646-664-1960 (US), +44 (0) 20-3936-2999 (UK) or +1-613-699-6539 (Canada), followed by the confirmation code 451092. Atlantica advises participants to access the conference call at least 15 minutes in advance.
The senior management team will also hold meetings with investors on March 1, at the BofA Flagship Power, Utilities & Clean Energy Leaders Conference in Boston, on March 2, at the Morgan Stanley Global Energy Power Conference in New York, and on March 6, at the J.P. Morgan Global High Yield & Leveraged Finance Conference in Miami.
Forward-Looking Statements
This press release contains forward-looking statements. These forward-looking statements include, but are not limited to, all statements other than statements of historical facts contained in this press release, including, without limitation, those regarding our future financial position and results of operations, our strategy, plans, objectives, goals and targets, or future developments in the markets in which we operate or are seeking to operate. In some cases, you can identify forward-looking statements by terminology such as "anticipate," "believe," "continue," "could," "estimate," "expect," "guidance," "may”, “potential”, "should" or "will" or the negative of such terms or other similar expressions or terminology. By their nature, forward-looking statements involve risks and uncertainties because they relate to events and depend on circumstances that may or may not occur in the future. Forward-looking statements speak only as of the date of this press release and are not guarantees of future performance and are based on numerous assumptions. Our actual results of operations, financial condition and the development of events may differ materially from (and be more negative than) those made in, or suggested by, the forward-looking statements. Except as required by law, we do not undertake any obligation to update any forward-looking statements to reflect events or circumstances after the date hereof or to reflect anticipated or unanticipated events or circumstances.
Investors should read the section entitled "Item 3.D—Risk Factors" and the description of our segments and business sectors in the section entitled "Item 4.B. Information on the Company—Business Overview", each in our Annual Report on Form 20-F for the year ended December 31, 2022, filed with the Securities and Exchange Commission (“SEC”), for a more complete discussion of the risks and factors that could affect us.
Forward-looking statements include, but are not limited to, statements relating to: expected value; new investments and projects, including the ones committed or earmarked for investment in 2023; projects currently under construction or expected to start construction, as well as their synergies with existing assets; statements with respect to our development pipeline and expected combined output capacity; the Inflation Reduction Act in the U.S (“IRA”) and benefits thereunder; equity investments; estimates, timelines and targets; financial flexibility; the delivery of accretive growth to our shareholders; the use of non-GAAP measures as a useful predicting tool for investors; dividends; achievement of environmental, social and governance goals; and various other factors, including those factors discussed under “Item 3.D—Risk Factors” and “Item 5.A—Operating Results” in our Annual Report on Form 20-F for the year ended December 31, 2022 filed with the SEC.
This communication discusses a process to explore and evaluate potential strategic alternatives. There can be no assurance that the strategic review process will lead to the approval or completion of any transaction or other strategic change.
The 2023 CAFD and 2023 Adjusted EBITDA referred to in section “2023 Guidance” are estimates as of March 1, 2023. These estimates are based on assumptions believed to be reasonable as of the date Atlantica published its Full Year 2022 Financial Results. Atlantica disclaims any current intention to update such guidance, except as required by law.
Non-GAAP Financial Measures
This press release also includes certain non-GAAP financial measures, including Adjusted EBITDA, CAFD and CAFD per share. Non-GAAP financial measures are not measurements of our performance or liquidity under IFRS as issued by IASB and should not be considered alternatives to operating profit or profit for the period or net cash provided by operating activities or any other performance measures derived in accordance with IFRS as issued by the IASB or any other generally accepted accounting principles or as alternatives to cash flow from operating, investing or financing activities. Please refer to the appendix of this press release for a reconciliation of the non-GAAP financial measures included in this press release to the most directly comparable financial measures prepared in accordance with IFRS. Also, please refer to the following paragraphs in this section for an explanation of the reasons why management believes the use of non-GAAP financial measures (including CAFD, CAFD per share and Adjusted EBITDA) in this press release provides useful information to investors.
We present non-GAAP financial measures because we believe that they and other similar measures are widely used by certain investors, securities analysts and other interested parties as supplemental measures of performance and liquidity. The non-GAAP financial measures may not be comparable to other similarly titled measures employed by other companies and may have limitations as analytical tools. These measures may not be fit for isolated consideration or as a substitute for analysis of our operating results as reported under IFRS as issued by the IASB. Non-GAAP financial measures and ratios are not measurements of our performance or liquidity under IFRS as issued by the IASB. Thus, they should not be considered as alternatives to operating profit, profit for the period, any other performance measures derived in accordance with IFRS as issued by the IASB, any other generally accepted accounting principles or as alternatives to cash flow from operating, investing or financing activities. Some of the limitations of these non-GAAP measures are:
they do not reflect our cash expenditures, future requirements for capital expenditures or contractual commitments;
they do not reflect changes in, or cash requirements for, our working capital needs;
they may not reflect the significant interest expense, or the cash requirements necessary, to service interest or principal payments, on our debts;
although depreciation and amortization are non-cash charges, the assets being depreciated and amortized will often need to be replaced in the future and Adjusted EBITDA, CAFD and CAFD per share do not reflect any cash requirements that would be required for such replacements;
some of the exceptional items that we eliminate in calculating Adjusted EBITDA reflect cash payments that were made, or will be made in the future; and
the fact that other companies in our industry may calculate Adjusted EBITDA, CAFD and CAFD per share differently than we do, which limits their usefulness as comparative measures.
We define Adjusted EBITDA as profit/(loss) for the period attributable to the Company, after previously adding back loss/(profit) attributable to non-controlling interest, income tax, expense, financial expense (net), depreciation, amortization and impairment charges of entities included in the consolidated financial statements and depreciation and amortization, financial expense and income tax expense of unconsolidated affiliates (pro rata of our equity ownership).
CAFD is calculated as cash distributions received by the Company from its subsidiaries minus cash expenses of the Company, including debt service and general and administrative expenses. CAFD per share is calculated by dividing CAFD for the year by the weighted average number of shares for the year (114,694,880 for the year ended on December 31, 2022, and 111,008,350 for December 31, 2021).
Our management believes Adjusted EBITDA, CAFD and CAFD per share are useful to investors and other users of our financial statements in evaluating our operating performance because it provides them with an additional tool to compare business performance across companies and across periods. Adjusted EBITDA is widely used by investors to measure a company’s operating performance without regard to items such as interest expense, taxes, depreciation and amortization, which can vary substantially from company to company depending upon accounting methods and book value of assets, capital structure and the method by which assets were acquired.
Our management believes CAFD and CAFD per share are relevant supplemental measures of the Company’s ability to earn and distribute cash returns to investors and are useful to investors in evaluating our operating performance because securities analysts and other interested parties use such calculations as a measure of our ability to make quarterly distributions. In addition, CAFD and CAFD per share are used by our management team for determining future acquisitions and managing our growth. Adjusted EBITDA, CAFD and CAFD per share are widely used by other companies in the same industry.
Our management uses Adjusted EBITDA, CAFD and CAFD per share as measures of operating performance to assist in comparing performance from period to period and aims to use them on a consistent basis moving forward. They also readily view operating trends as a measure for planning and forecasting overall expectations, for evaluating actual results against such expectations, and for communicating with our board of directors, shareholders, creditors, analysts and investors concerning our financial performance.
In our discussion of operating results, we have included foreign exchange impacts in our revenue and Adjusted EBITDA by providing constant currency growth. The constant currency presentation is not a measure recognized under IFRS and excludes the impact of fluctuations in foreign currency exchange rates. We believe providing constant currency information provides valuable supplemental information regarding our results of operations. We calculate constant currency amounts by converting our current period local currency revenue and Adjusted EBITDA using the prior period foreign currency average exchange rates and comparing these adjusted amounts to our prior period reported results. This calculation may differ from similarly titled measures used by others and, accordingly, the constant currency presentation is not meant to be a substitute for recorded amounts presented in conformity with IFRS as issued by the IASB nor should such amounts be considered in isolation.
Information presented as the pro-rata share of our unconsolidated affiliates reflects our proportionate ownership of each asset in our property portfolio that we do not consolidate and has been calculated by multiplying our unconsolidated affiliates’ financial statement line items by our percentage ownership thereto. Note 7 to our consolidated financial statements as of and for the year ended December 31, 2022 includes a description of our unconsolidated affiliates and our pro rata share thereof. We do not control the unconsolidated affiliates. Multiplying our unconsolidated affiliates’ financial statement line items by our percentage ownership may not accurately represent the legal and economic implications of holding a non-controlling interest in an unconsolidated affiliate. We include pro-rata share of depreciation and amortization, financial expense and income tax expense of unconsolidated affiliates because we believe it assists investors in estimating the effect of such items in the profit/(loss) of entities carried under the equity method (which is included in the calculation of our Adjusted EBITDA) based on our economic interest in such unconsolidated affiliates. Each unconsolidated affiliate may report a specific line item in its financial statements in a different manner. In addition, other companies in our industry may calculate their proportionate interest in unconsolidated affiliates differently than we do, limiting the usefulness of such information as a comparative measure. Because of these limitations, the information presented as the pro-rata share of our unconsolidated affiliates should not be considered in isolation or as a substitute for our or such unconsolidated affiliates’ financial statements as reported under applicable accounting principles.
Consolidated Statement of Operations
(Amounts in thousands of U.S. dollars)
|
| For the three-month period ended December 31, |
| For the year | ||||
|
| 2022 |
| 2021 |
| 2022 |
| 2021 |
Revenue | $ | 243,624 | $ | 271,331 | $ | 1,102,029 | $ | 1,211,749 |
Other operating income |
| 25,922 |
| 17,073 |
| 80,782 |
| 74,670 |
Employee benefit expenses |
| (21,466) |
| (19,653) |
| (80,232) |
| (78,758) |
Depreciation, amortization, and impairment charges |
| (99,579) |
| (104,525) |
| (473,638) |
| (439,441) |
Other operating expenses |
| (89,813) |
| (93,457) |
| (351,248) |
| (414,330) |
Operating profit | $ | 58,688 | $ | $ 70,769 | $ | 277,693 | $ | $ 353,890 |
Financial income |
| 2,202 |
| 907 |
| 5,569 |
| 2,755 |
Financial expense |
| (88,958) |
| (84,270) |
| (333,263) |
| (361,270) |
Net exchange differences |
| (3,580) |
| (173) |
| 10,257 |
| 1,873 |
Other financial income/(expense), net |
| 4,295 |
| (5,934) |
| 6,503 |
| 15,750 |
Financial expense, net | $ | (86,041) | $ | $ (89,470) | $ | (310,934) | $ | $ (340,892) |
Share of profit of entities carried under the equity method |
| 797 |
| 8,059 |
| 21,465 |
| 12,304 |
Profit/(loss) before income tax | $ | (26,556) | $ | $ (10,642) | $ | (11,776) | $ | $ 25,302 |
Income tax |
| 22,664 |
| 6,170 |
| 9,689 |
| (36,220) |
Profit/(loss) for the period | $ | (3,892) | $ | $ (4,472) | $ | (2,087) | $ | $ (10,918) |
Loss/(profit) attributable to non-controlling interests |
| 7,922 |
| (7,442) |
| (3,356) |
| (19,162) |
Profit/(loss) for the period attributable to the Company | $ | 4,030 | $ | $ (11,914) | $ | (5,443) | $ | $ (30,080) |
Weighted average number of ordinary shares outstanding (thousands) |
| 116,055 |
| 111,777 |
| 114,695 |
| 111,008 |
Weighted average number of ordinary shares diluted (thousands) |
| 119,402 |
| 115,615 |
| 118,501 |
| 114,523 |
Basic earnings per share (U.S. dollar per share) | $ | 0.03 | $ | $ (0.11) | $ | (0.05) | $ | $ (0.27) |
Diluted earnings per share (U.S. dollar per share) | $ | 0.03 | $ | $ (0.11) | $ | (0.05) | $ | $ (0.27) |
Consolidated Statement of Financial Position
(Amounts in thousands of U.S. dollars)
Assets | As of December 31, 2022 | As of December 31, 2021 |
| ||
Non-current assets |
|
|
| ||
| Contracted concessional, PP&E and other intangible assets | $ 7,483,259 | $ 8,021,568 |
| |
| Investments carried under the equity method | 260,031 | 294,581 |
| |
| Financial investments | 176,237 | 96,608 |
| |
| Deferred tax assets | 149,656 | 172,268 |
| |
Total non-current assets | $ 8,069,183 | $ 8,585,025 |
| ||
Current assets |
|
|
| ||
| Inventories | $ 34,511 | $ 29,694 |
| |
| Trade and other receivables | 200,334 | 307,143 |
| |
| Financial investments | 195,893 | 207,379 |
| |
| Cash and cash equivalents | 600,990 | 622,689 |
| |
Total current assets | $ 1,031,728 | $ 1,166,905 |
| ||
Total assets | $ 9,100,911 | $ 9,751,930 |
| ||
Equity and liabilities |
|
| |||
| Share capital | $ 11,606 | $ 11,240 | ||
| Share premium | 986,594 | 872,011 | ||
| Capital reserves | 814,951 | 1,020,027 | ||
| Other reserves | 345,567 | 171,272 | ||
| Accumulated currency translation differences | (161,307) | (133,450) | ||
| Accumulated deficit | (397,540) | (398,701) | ||
| Non-controlling interest | 189,176 | 206,206 | ||
Total equity | $ 1,789,047 | $ 1,748,605 | |||
Non-current liabilities |
|
| |||
| Long-term corporate debt | $ 1,000,503 | $ 995,190 | ||
| Long-term project debt | 4,226,518 | 4,387,674 | ||
| Grants and other liabilities | 1,252,513 | 1,263,744 | ||
| Derivative liabilities | 16,847 | 223,453 | ||
| Deferred tax liabilities | 296,481 | 308,859 | ||
Total non-current liabilities | $ 6,792,862 | $ 7,178,920 | |||
Current liabilities |
|
| |||
| Short-term corporate debt | $ 16,697 | $ 27,881 | ||
| Short-term project debt | 326,534 | 648,519 | ||
| Trade payables and other current liabilities | 140,230 | 113,907 | ||
| Income and other tax payables | 35,541 | 34,098 | ||
Total current liabilities | $ 519,002 | $ 824,405 | |||
Total equity and liabilities | $ 9,100,911 | $ 9,751,930 | |||
Consolidated Cash Flow Statement
(Amounts in thousands of U.S. dollars)
| For the three-month period ended December 31, |
| For the year ended December 31, | |||||||
| 2022 |
| 2021 |
| 2022 |
| 2021 |
| ||
Profit/(loss) for the period | $ (3,892) |
| $ (4,473) |
| $ (2,087) |
| $ (10,918) |
| ||
Financial expense and non-monetary adjustments | 158,609 |
| 199,939 |
| 786,888 |
| 861,931 |
| ||
Profit for the period adjusted by financial expense and non-monetary adjustments | $ 154,717 |
| $ 195,466 |
| $ 784,801 |
| $ 851,013 |
| ||
Changes in working capital | 31,027 |
| 1,451 |
| 78,805 |
| (3,127) |
| ||
Net interest and income tax paid | (115,148) |
| (133,234) |
| (277,284) |
| (342,263) |
| ||
Net cash provided by operating activities | $ 70,596 |
| $ 63,683 |
| $ 586,322 |
| $ 505,623 |
| ||
Acquisitions of subsidiaries and entities under the equity method | (4,954) |
| (24,910) |
| (50,507) |
| (362,449) |
| ||
Investments in operating concessional assets | (11,217) |
| (10,060) |
| (39,107) |
| (19,216) |
| ||
Investments in assets under development or construction | (6,378) |
| (4,274) |
| (36,784) |
| (7,028) |
| ||
Distributions from entities under the equity method | 11,493 |
| 10,268 |
| 67,695 |
| 34,883 |
| ||
Other non-current assets | 1,684 |
| 718 |
| 1,265 |
| 2,655 |
| ||
|
|
|
|
|
|
|
|
| ||
Net cash used in investing activities | $ (9,372) |
| $ (28,258) |
| $ (57,438) |
| $ (351,155) |
| ||
|
|
|
|
|
|
|
|
| ||
Net cash used in financing activities | $ (271,901) |
| $ (172,198) |
| $(535,018) |
| $ (380,163) |
| ||
|
|
|
|
|
|
|
|
| ||
Net decrease in cash and cash equivalents | $ (210,677) |
| $ (136,773) |
| $ (6,134) |
| $ (225,695) |
| ||
Cash and cash equivalents at beginning of the period | 781,575 |
| 763,545 |
| 622,689 |
| 868,501 |
| ||
Translation differences in cash or cash equivalent | 30,090 |
| (4,083) |
| (15,565) |
| (20,117) |
| ||
Cash and cash equivalents at end of the period | $ 600,990 |
| $ 622,689 |
| $ 600,990 |
| $ 622,689 |
| ||
Reconciliation of Adjusted EBITDA to Net cash provided by operating activities
(in thousands of U.S. dollars) | For the three-month period ended December 31, |
| For the year ended December 31, | ||||
| 2022 |
| 2021 |
| 2022 |
| 2021 |
Net cash provided by operating activities | $ 70,596 |
| $ 63,683 |
| $ 586,322 |
| $ 505,623 |
Net interest and income tax paid | 115,148 |
| 133,234 |
| 277,284 |
| 342,263 |
Changes in working capital | (31,027) |
| (1,451) |
| (78,805) |
| 3,127 |
Non-monetary items & other | 3,550 |
| (20,172) |
| (33,470) |
| (57,682) |
Atlantica’s pro-rata share of EBITDA from unconsolidated affiliates | 8,192 |
| 15,013 |
| 45,769 |
| 31,057 |
Adjusted EBITDA | $ 166,459 |
| $ 190,307 |
| $ 797,100 |
| $ 824,388 |
Reconciliation of CAFD to CAFD per share
(in thousands of U.S. dollars) | For the three-month period ended December 31, |
| For the year ended December 31, | ||||||
| 2022 |
| 2021 |
| 2022 |
| 2021 |
| |
CAFD (in thousands of U.S. dollars) | $ 58,862 |
| $ 57,073 |
| $ 237,872 |
| $ 225,547 |
| |
Weighted average number of shares (basic) for the period (in thousands) | 116,055 |
| 111,777 |
| 114,695 |
| 111,008 |
| |
CAFD per share (in U.S. dollars) | $ 0.5072 |
| $ 0.5106 |
| $ 2.0740 |
| $ 2.0318 |
| |
Reconciliation of CAFD and Adjusted EBITDA to Profit/(loss) for the period attributable to the Company
(in thousands of U.S. dollars) | For the three-month period ended December 31, |
| For the year ended December 31, |
|
| |||||||
| 2022 |
| 2021 |
| 2022 |
| 2021 | |||||
Profit/(loss) for the period attributable to the Company | $ 4,030 |
| $ (11,914) |
| $ (5,443) |
| $ (30,080) |
| ||||
Profit/(loss) attributable to non-controlling interest | (7,922) |
| 7,442 |
| 3,356 |
| 19,162 |
| ||||
Income tax | (22,664) |
| (6,170) |
| (9,689) |
| 36,220 |
| ||||
Depreciation and amortization, financial expense and income tax expense of unconsolidated affiliates (pro rata of our equity ownership) | 7,395 |
| 6,954 |
| 24,304 |
| 18,753 |
| ||||
Financial expense, net | 86,041 |
| 89,470 |
| 310,934 |
| 340,892 |
| ||||
Depreciation, amortization, and impairment charges | 99,579 |
| 104,525 |
| 473,638 |
| 439,441 |
| ||||
Adjusted EBITDA | $ 166,459 |
| $ 190,307 |
| $ 797,100 |
| $ 824,388 |
| ||||
Atlantica’s pro-rata share of EBITDA from unconsolidated affiliates | (8,192) |
| (15,013) |
| (45,769) |
| (31,057) |
| ||||
Non-monetary items | (4,196) |
| 20,346 |
| 27,996 |
| 55,809 |
| ||||
Accounting provision for electricity market prices in Spain | (2,980) |
| 24,489 |
| 25,253 |
| 77,055 |
| ||||
Difference between billings and revenue in assets accounted for as concessional financial assets | 13,434 |
| 11,959 |
| 61,631 |
| 38,890 |
| ||||
Income from cash grants in the US | (14,650) |
| (14,678) |
| (58,888) |
| (58,711) |
| ||||
Other non monetary items | - |
| (1,424) |
| - |
| (1,424) |
| ||||
Maintenance Capex | (4,847) |
| (13,100) |
| (18,588) |
| (17,722) |
| ||||
Dividends from equity method investments | 11,493 |
| 10,268 |
| 67,695 |
| 34,883 |
| ||||
Net interest and income tax paid | (115,148) |
| (133,234) |
| (277,284) |
| (342,263) |
| ||||
Changes in other assets and liabilities | 49,885 |
| 21,806 |
| 102,896 |
| 43,696 |
| ||||
Deposits into/ withdrawals from restricted accounts15 | 33,696 |
| 23,595 |
| 33,018 |
| 2,729 |
| ||||
Change in non-restricted cash at project level17 | 125,662 |
| 115,588 |
| (61,672) |
| 2,209 |
| ||||
Dividends paid to non-controlling interests | (12,767) |
| (4,807) |
| (39,209) |
| (28,134) |
| ||||
Debt principal repayments | (183,183) |
| (158,684) |
| (348,311) |
| (318,991) |
| ||||
Cash Available For Distribution | $ 58,862 |
| $ 57,073 |
| $ 237,872 |
| $ 225,547 |
| ||||
|
|
|
|
|
|
|
|
| ||||
Reconciliation of 2023 Target Guidance for Adjusted EBITDA to CAFD
|
| Guidance16 |
(in millions of U.S. dollars) |
| 2023E |
Adjusted EBITDA |
| 790 – 850 |
Atlantica’s pro-rata share of EBITDA from unconsolidated affiliates |
| (40) – (50) |
Dividends from unconsolidated affiliates |
| 50 – 60 |
Non-monetary items17 |
| 40 – 90 |
Net interest and income tax paid |
| (330) – (350) |
Maintenance Capex |
| (30) – (50) |
Changes in other assets and liabilities and change in available cash at project level |
| 0 – 80 |
Cash Available For Distribution |
| 235 - 260 |
About Atlantica
Atlantica Sustainable Infrastructure plc is a sustainable infrastructure company that owns a diversified portfolio of contracted renewable energy, storage, efficient natural gas, electric transmission and water assets in North & South America, and certain markets in EMEA (www.atlantica.com).
Chief Financial Officer | Investor Relations & Communication |
1 Compared to 2021, on a constant currency basis and adjusted for the consolidation of a non-recurrent Rioglass solar project in 2021.
2 CAFD per share is calculated by dividing CAFD for the year by the weighted average number of shares for the year.
3 Represents total installed capacity in assets owned or consolidated at the end of the year, regardless of our percentage of ownership in each of the assets, except for Vento II, for which we have included our 49% interest.
4 Includes 49% of Vento II production since its acquisition. Includes curtailment in wind assets for which we receive compensation.
5 Includes 43 MW corresponding to our 30% share in Monterrey and 55 MWt corresponding to thermal capacity from Calgary District Heating.
6 GWh produced includes 30% share of the production from Monterrey.
7 Availability refers to the time during which the asset was available to our client totally or partially divided by contracted or budgeted availability, as applicable.
8 Corporate liquidity means cash and cash equivalents held at Atlantica Sustainable Infrastructure plc as of December 31, 2022, and available revolver capacity as of December 31, 2022.
9 Net project debt is calculated as long-term project debt plus short-term project debt minus cash and cash equivalents at the consolidated project level.
10 Net corporate debt is calculated as long-term corporate debt plus short-term corporate debt minus cash and cash equivalents at Atlantica’s corporate level.
11 Net corporate leverage is calculated as net corporate debt divided by 2022 CAFD before corporate debt service. CAFD pre-corporate debt service is calculated as CAFD plus corporate debt interest paid by Atlantica.
12 Estimation of equity already invested, committed or earmarked for investment in 2023 in projects currently under construction or expected to start construction in 2023, including expansions and repowerings.
13 Only includes projects estimated to be ready to build before or in 2030 of approximately 3.3 GW, 2.0 GW of renewable energy and 1.3 GW of storage (equivalent to 5.6 GWh). Capacity measured by multiplying the size of each project by Atlantica’s ownership. Potential expansions of transmission lines not included.
14 Adjusted EBITDA guidance includes a negative $60.2 million non-cash adjustment corresponding to the difference between billings and revenue in assets accounted for as concessional financial assets, primarily related to ACT, a negative non-cash provision of up to $65.5 million related to electricity prices in Spain and a positive non-cash adjustment of $58.4 million corresponding to U.S. cash grants.
15 “Deposits into/ withdrawals from restricted accounts” and “Change in non-restricted cash at project level” are calculated on a constant currency basis to reflect actual cash movements isolated from the impact of variations generated by foreign exchange changes during the period.
16 The forward-looking measures of 2023 Adjusted EBITDA and CAFD are non-GAAP measures that cannot be reconciled to the most directly comparable GAAP financial measure without unreasonable effort primarily because of the uncertainties involved in estimating forward looking income tax expense, mark-to-market changes in derivatives, profit attributable to non-controlling interest and Share of loss/(profit) of entities carried under the equity method to arrive at net income and which are subtracted therefrom to arrive to CAFD.
17 Non-monetary items include (1) a positive non-cash adjustment for approximately $60.2 million corresponding to the difference between billings and revenue in assets accounted for as concessional financial assets, primarily related to ACT, (2) a positive non-cash adjustment of up to $65.5 million related to electricity market prices in Spain and (3) a negative non-cash adjustment of approximately $58.4 million related to income from cash grants in the U.S.
Attachments

