
 Yahoo Finance
 Babcock International Group's (LON:BAB) Stock Price Has Reduced 76% In The Past Five Years

Long term investing works well, but it doesn't always work for each individual stock. We really hate to see fellow investors lose their hard-earned money. Imagine if you held Babcock International Group PLC (LON:BAB) for half a decade as the share price tanked 76%. And we doubt long term believers are the only worried holders, since the stock price has declined 57% over the last twelve months. Shareholders have had an even rougher run lately, with the share price down 16% in the last 90 days.
Check out our latest analysis for Babcock International Group
There is no denying that markets are sometimes efficient, but prices do not always reflect underlying business performance. One flawed but reasonable way to assess how sentiment around a company has changed is to compare the earnings per share (EPS) with the share price.
Over five years Babcock International Group's earnings per share dropped significantly, falling to a loss, with the share price also lower. The recent extraordinary items contributed to this situation. Since the company has fallen to a loss making position, it's hard to compare the change in EPS with the share price change. But we would generally expect a lower price, given the situation.
The graphic below depicts how EPS has changed over time (unveil the exact values by clicking on the image).
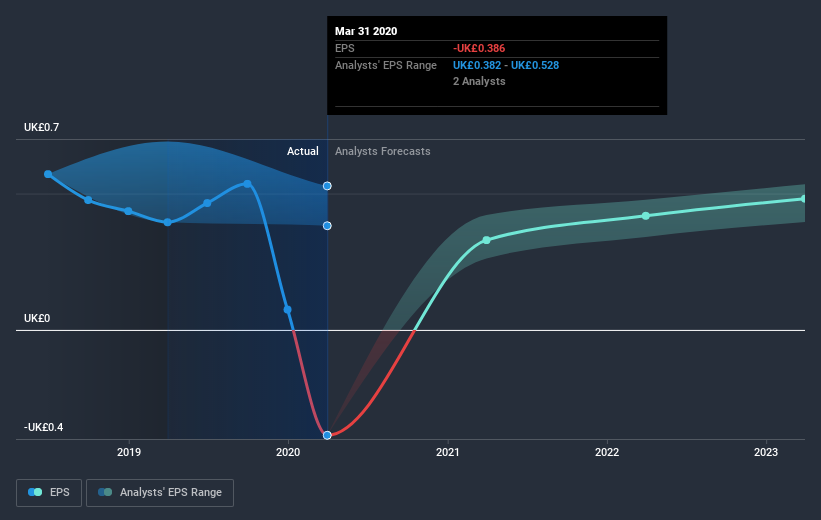
We like that insiders have been buying shares in the last twelve months. Having said that, most people consider earnings and revenue growth trends to be a more meaningful guide to the business. Dive deeper into the earnings by checking this interactive graph of Babcock International Group's earnings, revenue and cash flow.
What About Dividends?
It is important to consider the total shareholder return, as well as the share price return, for any given stock. Whereas the share price return only reflects the change in the share price, the TSR includes the value of dividends (assuming they were reinvested) and the benefit of any discounted capital raising or spin-off. It's fair to say that the TSR gives a more complete picture for stocks that pay a dividend. In the case of Babcock International Group, it has a TSR of -72% for the last 5 years. That exceeds its share price return that we previously mentioned. The dividends paid by the company have thusly boosted the total shareholder return.
A Different Perspective
We regret to report that Babcock International Group shareholders are down 56% for the year (even including dividends). Unfortunately, that's worse than the broader market decline of 13%. However, it could simply be that the share price has been impacted by broader market jitters. It might be worth keeping an eye on the fundamentals, in case there's a good opportunity. Unfortunately, last year's performance may indicate unresolved challenges, given that it was worse than the annualised loss of 11% over the last half decade. We realise that Baron Rothschild has said investors should "buy when there is blood on the streets", but we caution that investors should first be sure they are buying a high quality business. It's always interesting to track share price performance over the longer term. But to understand Babcock International Group better, we need to consider many other factors. To that end, you should learn about the 3 warning signs we've spotted with Babcock International Group (including 1 which is doesn't sit too well with us) .
If you like to buy stocks alongside management, then you might just love this free list of companies. (Hint: insiders have been buying them).
Please note, the market returns quoted in this article reflect the market weighted average returns of stocks that currently trade on GB exchanges.
This article by Simply Wall St is general in nature. It does not constitute a recommendation to buy or sell any stock, and does not take account of your objectives, or your financial situation. We aim to bring you long-term focused analysis driven by fundamental data. Note that our analysis may not factor in the latest price-sensitive company announcements or qualitative material. Simply Wall St has no position in any stocks mentioned.
Have feedback on this article? Concerned about the content? Get in touch with us directly. Alternatively, email editorial-team@simplywallst.com.
