
 Yahoo Finance
 Balfour Beatty (LON:BBY) Might Have The Makings Of A Multi-Bagger
What trends should we look for it we want to identify stocks that can multiply in value over the long term? Firstly, we'll want to see a proven return on capital employed (ROCE) that is increasing, and secondly, an expanding base of capital employed. Ultimately, this demonstrates that it's a business that is reinvesting profits at increasing rates of return. So when we looked at Balfour Beatty (LON:BBY) and its trend of ROCE, we really liked what we saw.
Return On Capital Employed (ROCE): What Is It?
For those that aren't sure what ROCE is, it measures the amount of pre-tax profits a company can generate from the capital employed in its business. To calculate this metric for Balfour Beatty, this is the formula:
Return on Capital Employed = Earnings Before Interest and Tax (EBIT) ÷ (Total Assets - Current Liabilities)
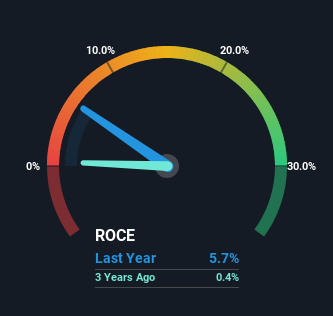
0.057 = UK£146m ÷ (UK£5.3b - UK£2.7b) (Based on the trailing twelve months to December 2023).
Thus, Balfour Beatty has an ROCE of 5.7%. Ultimately, that's a low return and it under-performs the Construction industry average of 12%.
See our latest analysis for Balfour Beatty
Above you can see how the current ROCE for Balfour Beatty compares to its prior returns on capital, but there's only so much you can tell from the past. If you'd like to see what analysts are forecasting going forward, you should check out our free analyst report for Balfour Beatty .
The Trend Of ROCE
Balfour Beatty has not disappointed with their ROCE growth. Looking at the data, we can see that even though capital employed in the business has remained relatively flat, the ROCE generated has risen by 77% over the last five years. Basically the business is generating higher returns from the same amount of capital and that is proof that there are improvements in the company's efficiencies. The company is doing well in that sense, and it's worth investigating what the management team has planned for long term growth prospects.
Another thing to note, Balfour Beatty has a high ratio of current liabilities to total assets of 52%. This can bring about some risks because the company is basically operating with a rather large reliance on its suppliers or other sorts of short-term creditors. Ideally we'd like to see this reduce as that would mean fewer obligations bearing risks.
What We Can Learn From Balfour Beatty's ROCE
In summary, we're delighted to see that Balfour Beatty has been able to increase efficiencies and earn higher rates of return on the same amount of capital. Since the stock has returned a solid 61% to shareholders over the last five years, it's fair to say investors are beginning to recognize these changes. In light of that, we think it's worth looking further into this stock because if Balfour Beatty can keep these trends up, it could have a bright future ahead.
One more thing, we've spotted 2 warning signs facing Balfour Beatty that you might find interesting.
While Balfour Beatty may not currently earn the highest returns, we've compiled a list of companies that currently earn more than 25% return on equity. Check out this free list here.
Have feedback on this article? Concerned about the content? Get in touch with us directly. Alternatively, email editorial-team (at) simplywallst.com.
This article by Simply Wall St is general in nature. We provide commentary based on historical data and analyst forecasts only using an unbiased methodology and our articles are not intended to be financial advice. It does not constitute a recommendation to buy or sell any stock, and does not take account of your objectives, or your financial situation. We aim to bring you long-term focused analysis driven by fundamental data. Note that our analysis may not factor in the latest price-sensitive company announcements or qualitative material. Simply Wall St has no position in any stocks mentioned.
