
 Yahoo Finance
 Is Balfour Beatty plc's (LON:BBY) Balance Sheet Strong Enough To Weather A Storm?

Want to participate in a short research study? Help shape the future of investing tools and you could win a $250 gift card!
Small and large cap stocks are widely popular for a variety of reasons, however, mid-cap companies such as Balfour Beatty plc (LON:BBY), with a market cap of UK£1.6b, often get neglected by retail investors. However, generally ignored mid-caps have historically delivered better risk adjusted returns than both of those groups. This article will examine BBY’s financial liquidity and debt levels to get an idea of whether the company can deal with cyclical downturns and maintain funds to accommodate strategic spending for future growth. Don’t forget that this is a general and concentrated examination of Balfour Beatty’s financial health, so you should conduct further analysis into BBY here.
See our latest analysis for Balfour Beatty
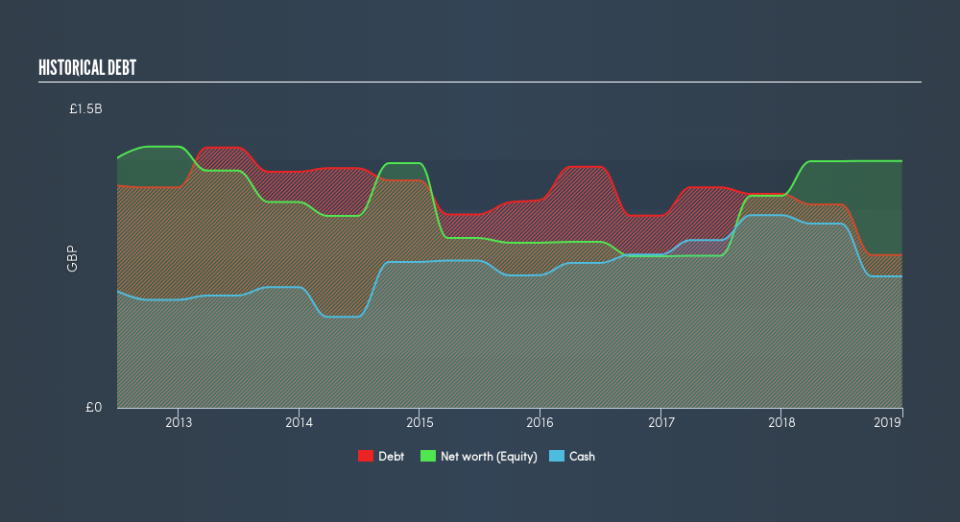
BBY’s Debt (And Cash Flows)
BBY's debt levels have fallen from UK£1.1b to UK£768m over the last 12 months – this includes long-term debt. With this reduction in debt, BBY currently has UK£661m remaining in cash and short-term investments to keep the business going. Moving on, operating cash flow was negative over the last twelve months. As the purpose of this article is a high-level overview, I won’t be looking at this today, but you can take a look at some of BBY’s operating efficiency ratios such as ROA here.
Can BBY meet its short-term obligations with the cash in hand?
With current liabilities at UK£2.1b, the company arguably has a rather low level of current assets relative its obligations, with the current ratio last standing at 0.96x. The current ratio is the number you get when you divide current assets by current liabilities.
Is BBY’s debt level acceptable?
BBY is a relatively highly levered company with a debt-to-equity of 62%. This is not unusual for mid-caps as debt tends to be a cheaper and faster source of funding for some businesses. We can check to see whether BBY is able to meet its debt obligations by looking at the net interest coverage ratio. A company generating earnings before interest and tax (EBIT) at least three times its net interest payments is considered financially sound. In BBY's, case, the ratio of 3.71x suggests that interest is appropriately covered, which means that lenders may be less hesitant to lend out more funding as BBY’s high interest coverage is seen as responsible and safe practice.
Next Steps:
BBY’s high cash coverage means that, although its debt levels are high, the company is able to utilise its borrowings efficiently in order to generate cash flow. Though its lack of liquidity raises questions over current asset management practices for the mid-cap. I admit this is a fairly basic analysis for BBY's financial health. Other important fundamentals need to be considered alongside. I suggest you continue to research Balfour Beatty to get a more holistic view of the stock by looking at:
Future Outlook: What are well-informed industry analysts predicting for BBY’s future growth? Take a look at our free research report of analyst consensus for BBY’s outlook.
Valuation: What is BBY worth today? Is the stock undervalued, even when its growth outlook is factored into its intrinsic value? The intrinsic value infographic in our free research report helps visualize whether BBY is currently mispriced by the market.
Other High-Performing Stocks: Are there other stocks that provide better prospects with proven track records? Explore our free list of these great stocks here.
We aim to bring you long-term focused research analysis driven by fundamental data. Note that our analysis may not factor in the latest price-sensitive company announcements or qualitative material.
If you spot an error that warrants correction, please contact the editor at editorial-team@simplywallst.com. This article by Simply Wall St is general in nature. It does not constitute a recommendation to buy or sell any stock, and does not take account of your objectives, or your financial situation. Simply Wall St has no position in the stocks mentioned. Thank you for reading.
