
 Yahoo Finance
 Bath & Body Works' (NYSE:BBWI) investors will be pleased with their stellar 198% return over the last five years
When you buy a stock there is always a possibility that it could drop 100%. But on a lighter note, a good company can see its share price rise well over 100%. One great example is Bath & Body Works, Inc. (NYSE:BBWI) which saw its share price drive 115% higher over five years. It's also up 11% in about a month. But the price may well have benefitted from a buoyant market, since stocks have gained 6.0% in the last thirty days.
So let's investigate and see if the longer term performance of the company has been in line with the underlying business' progress.
Check out our latest analysis for Bath & Body Works
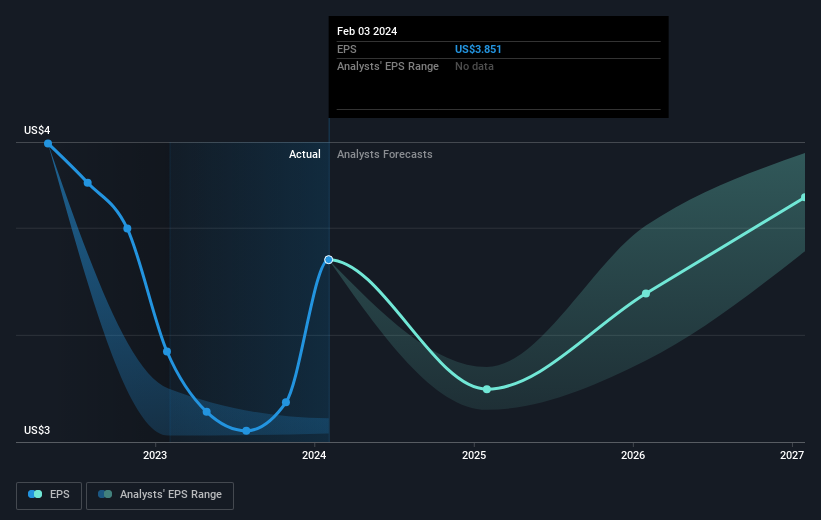
To paraphrase Benjamin Graham: Over the short term the market is a voting machine, but over the long term it's a weighing machine. One way to examine how market sentiment has changed over time is to look at the interaction between a company's share price and its earnings per share (EPS).
During five years of share price growth, Bath & Body Works achieved compound earnings per share (EPS) growth of 11% per year. This EPS growth is lower than the 17% average annual increase in the share price. So it's fair to assume the market has a higher opinion of the business than it did five years ago. And that's hardly shocking given the track record of growth.
You can see below how EPS has changed over time (discover the exact values by clicking on the image).
We know that Bath & Body Works has improved its bottom line lately, but is it going to grow revenue? Check if analysts think Bath & Body Works will grow revenue in the future.
What About Dividends?
It is important to consider the total shareholder return, as well as the share price return, for any given stock. The TSR is a return calculation that accounts for the value of cash dividends (assuming that any dividend received was reinvested) and the calculated value of any discounted capital raisings and spin-offs. It's fair to say that the TSR gives a more complete picture for stocks that pay a dividend. In the case of Bath & Body Works, it has a TSR of 198% for the last 5 years. That exceeds its share price return that we previously mentioned. This is largely a result of its dividend payments!
A Different Perspective
Bath & Body Works provided a TSR of 30% over the year (including dividends). That's fairly close to the broader market return. That gain looks pretty satisfying, and it is even better than the five-year TSR of 24% per year. It is possible that management foresight will bring growth well into the future, even if the share price slows down. It's always interesting to track share price performance over the longer term. But to understand Bath & Body Works better, we need to consider many other factors. Take risks, for example - Bath & Body Works has 4 warning signs (and 1 which makes us a bit uncomfortable) we think you should know about.
But note: Bath & Body Works may not be the best stock to buy. So take a peek at this free list of interesting companies with past earnings growth (and further growth forecast).
Please note, the market returns quoted in this article reflect the market weighted average returns of stocks that currently trade on American exchanges.
Have feedback on this article? Concerned about the content? Get in touch with us directly. Alternatively, email editorial-team (at) simplywallst.com.
This article by Simply Wall St is general in nature. We provide commentary based on historical data and analyst forecasts only using an unbiased methodology and our articles are not intended to be financial advice. It does not constitute a recommendation to buy or sell any stock, and does not take account of your objectives, or your financial situation. We aim to bring you long-term focused analysis driven by fundamental data. Note that our analysis may not factor in the latest price-sensitive company announcements or qualitative material. Simply Wall St has no position in any stocks mentioned.
