
 Yahoo Finance
 On the Beach Group (LON:OTB) Is Reinvesting At Lower Rates Of Return
To find a multi-bagger stock, what are the underlying trends we should look for in a business? Typically, we'll want to notice a trend of growing return on capital employed (ROCE) and alongside that, an expanding base of capital employed. Basically this means that a company has profitable initiatives that it can continue to reinvest in, which is a trait of a compounding machine. Having said that, from a first glance at On the Beach Group (LON:OTB) we aren't jumping out of our chairs at how returns are trending, but let's have a deeper look.
What Is Return On Capital Employed (ROCE)?
Just to clarify if you're unsure, ROCE is a metric for evaluating how much pre-tax income (in percentage terms) a company earns on the capital invested in its business. Analysts use this formula to calculate it for On the Beach Group:
Return on Capital Employed = Earnings Before Interest and Tax (EBIT) ÷ (Total Assets - Current Liabilities)
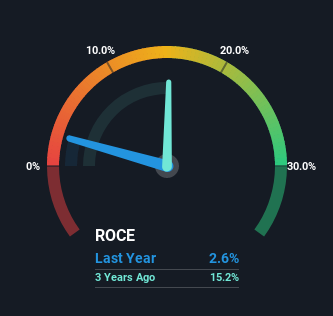
0.026 = UK£4.2m ÷ (UK£347m - UK£187m) (Based on the trailing twelve months to September 2022).
So, On the Beach Group has an ROCE of 2.6%. Ultimately, that's a low return and it under-performs the Hospitality industry average of 6.3%.
View our latest analysis for On the Beach Group
Above you can see how the current ROCE for On the Beach Group compares to its prior returns on capital, but there's only so much you can tell from the past. If you're interested, you can view the analysts predictions in our free report on analyst forecasts for the company.
What Does the ROCE Trend For On the Beach Group Tell Us?
In terms of On the Beach Group's historical ROCE movements, the trend isn't fantastic. Around five years ago the returns on capital were 23%, but since then they've fallen to 2.6%. However, given capital employed and revenue have both increased it appears that the business is currently pursuing growth, at the consequence of short term returns. And if the increased capital generates additional returns, the business, and thus shareholders, will benefit in the long run.
On a side note, On the Beach Group's current liabilities are still rather high at 54% of total assets. This can bring about some risks because the company is basically operating with a rather large reliance on its suppliers or other sorts of short-term creditors. While it's not necessarily a bad thing, it can be beneficial if this ratio is lower.
Our Take On On the Beach Group's ROCE
While returns have fallen for On the Beach Group in recent times, we're encouraged to see that sales are growing and that the business is reinvesting in its operations. And there could be an opportunity here if other metrics look good too, because the stock has declined 65% in the last five years. So we think it'd be worthwhile to look further into this stock given the trends look encouraging.
If you want to continue researching On the Beach Group, you might be interested to know about the 2 warning signs that our analysis has discovered.
While On the Beach Group isn't earning the highest return, check out this free list of companies that are earning high returns on equity with solid balance sheets.
Have feedback on this article? Concerned about the content? Get in touch with us directly. Alternatively, email editorial-team (at) simplywallst.com.
This article by Simply Wall St is general in nature. We provide commentary based on historical data and analyst forecasts only using an unbiased methodology and our articles are not intended to be financial advice. It does not constitute a recommendation to buy or sell any stock, and does not take account of your objectives, or your financial situation. We aim to bring you long-term focused analysis driven by fundamental data. Note that our analysis may not factor in the latest price-sensitive company announcements or qualitative material. Simply Wall St has no position in any stocks mentioned.
Join A Paid User Research Session
You’ll receive a US$30 Amazon Gift card for 1 hour of your time while helping us build better investing tools for the individual investors like yourself. Sign up here
