
 Yahoo Finance
 The Berkeley Group Holdings (LON:BKG) Share Price Has Gained 67% And Shareholders Are Hoping For More

Want to participate in a short research study? Help shape the future of investing tools and you could win a $250 gift card!
When we invest, we're generally looking for stocks that outperform the market average. And while active stock picking involves risks (and requires diversification) it can also provide excess returns. To wit, the Berkeley Group Holdings share price has climbed 67% in five years, easily topping the market return of 0.4% (ignoring dividends).
Check out our latest analysis for Berkeley Group Holdings
To paraphrase Benjamin Graham: Over the short term the market is a voting machine, but over the long term it's a weighing machine. By comparing earnings per share (EPS) and share price changes over time, we can get a feel for how investor attitudes to a company have morphed over time.
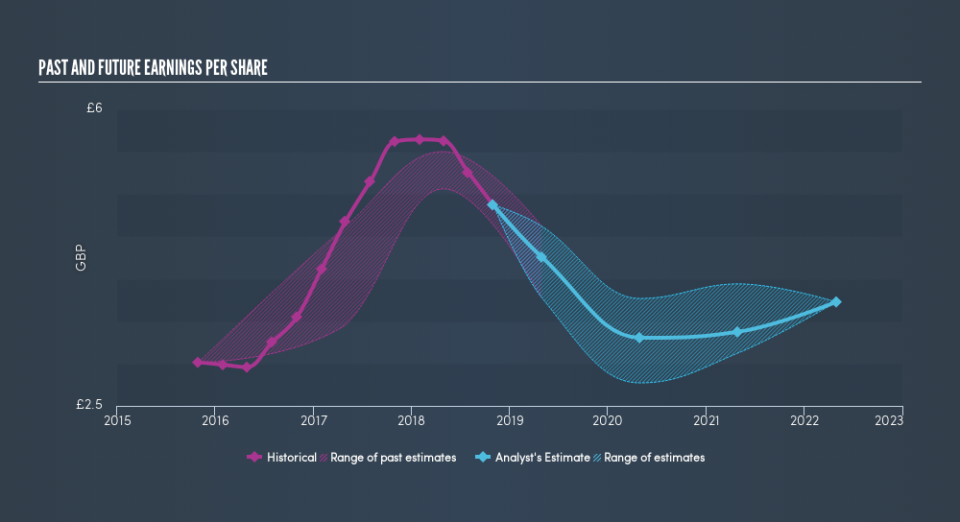
Over half a decade, Berkeley Group Holdings managed to grow its earnings per share at 22% a year. This EPS growth is higher than the 11% average annual increase in the share price. So it seems the market isn't so enthusiastic about the stock these days. This cautious sentiment is reflected in its (fairly low) P/E ratio of 7.51.
You can see how EPS has changed over time in the image below (click on the chart to see the exact values).
Before buying or selling a stock, we always recommend a close examination of historic growth trends, available here..
What About Dividends?
When looking at investment returns, it is important to consider the difference between total shareholder return (TSR) and share price return. The TSR is a return calculation that accounts for the value of cash dividends (assuming that any dividend received was reinvested) and the calculated value of any discounted capital raisings and spin-offs. It's fair to say that the TSR gives a more complete picture for stocks that pay a dividend. We note that for Berkeley Group Holdings the TSR over the last 5 years was 111%, which is better than the share price return mentioned above. And there's no prize for guessing that the dividend payments largely explain the divergence!
A Different Perspective
While the broader market lost about 2.4% in the twelve months, Berkeley Group Holdings shareholders did even worse, losing 10% (even including dividends). Having said that, it's inevitable that some stocks will be oversold in a falling market. The key is to keep your eyes on the fundamental developments. On the bright side, long term shareholders have made money, with a gain of 16% per year over half a decade. It could be that the recent sell-off is an opportunity, so it may be worth checking the fundamental data for signs of a long term growth trend. If you would like to research Berkeley Group Holdings in more detail then you might want to take a look at whether insiders have been buying or selling shares in the company.
If you are like me, then you will not want to miss this free list of growing companies that insiders are buying.
Please note, the market returns quoted in this article reflect the market weighted average returns of stocks that currently trade on GB exchanges.
We aim to bring you long-term focused research analysis driven by fundamental data. Note that our analysis may not factor in the latest price-sensitive company announcements or qualitative material.
If you spot an error that warrants correction, please contact the editor at editorial-team@simplywallst.com. This article by Simply Wall St is general in nature. It does not constitute a recommendation to buy or sell any stock, and does not take account of your objectives, or your financial situation. Simply Wall St has no position in the stocks mentioned. Thank you for reading.
