
 Yahoo Finance
 Bertrandt (ETR:BDT) Has Some Difficulty Using Its Capital Effectively
Ignoring the stock price of a company, what are the underlying trends that tell us a business is past the growth phase? A business that's potentially in decline often shows two trends, a return on capital employed (ROCE) that's declining, and a base of capital employed that's also declining. Basically the company is earning less on its investments and it is also reducing its total assets. So after glancing at the trends within Bertrandt (ETR:BDT), we weren't too hopeful.
Return On Capital Employed (ROCE): What Is It?
For those who don't know, ROCE is a measure of a company's yearly pre-tax profit (its return), relative to the capital employed in the business. Analysts use this formula to calculate it for Bertrandt:
Return on Capital Employed = Earnings Before Interest and Tax (EBIT) ÷ (Total Assets - Current Liabilities)
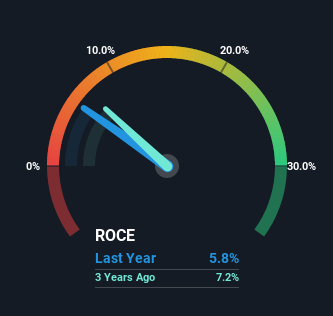
0.058 = €36m ÷ (€956m - €336m) (Based on the trailing twelve months to September 2022).
Thus, Bertrandt has an ROCE of 5.8%. In absolute terms, that's a low return and it also under-performs the Professional Services industry average of 7.7%.
Check out our latest analysis for Bertrandt
In the above chart we have measured Bertrandt's prior ROCE against its prior performance, but the future is arguably more important. If you'd like to see what analysts are forecasting going forward, you should check out our free report for Bertrandt.
So How Is Bertrandt's ROCE Trending?
We are a bit worried about the trend of returns on capital at Bertrandt. Unfortunately the returns on capital have diminished from the 9.8% that they were earning five years ago. On top of that, it's worth noting that the amount of capital employed within the business has remained relatively steady. Companies that exhibit these attributes tend to not be shrinking, but they can be mature and facing pressure on their margins from competition. If these trends continue, we wouldn't expect Bertrandt to turn into a multi-bagger.
On a side note, Bertrandt's current liabilities have increased over the last five years to 35% of total assets, effectively distorting the ROCE to some degree. Without this increase, it's likely that ROCE would be even lower than 5.8%. While the ratio isn't currently too high, it's worth keeping an eye on this because if it gets particularly high, the business could then face some new elements of risk.
Our Take On Bertrandt's ROCE
In the end, the trend of lower returns on the same amount of capital isn't typically an indication that we're looking at a growth stock. It should come as no surprise then that the stock has fallen 59% over the last five years, so it looks like investors are recognizing these changes. That being the case, unless the underlying trends revert to a more positive trajectory, we'd consider looking elsewhere.
Like most companies, Bertrandt does come with some risks, and we've found 1 warning sign that you should be aware of.
For those who like to invest in solid companies, check out this free list of companies with solid balance sheets and high returns on equity.
Have feedback on this article? Concerned about the content? Get in touch with us directly. Alternatively, email editorial-team (at) simplywallst.com.
This article by Simply Wall St is general in nature. We provide commentary based on historical data and analyst forecasts only using an unbiased methodology and our articles are not intended to be financial advice. It does not constitute a recommendation to buy or sell any stock, and does not take account of your objectives, or your financial situation. We aim to bring you long-term focused analysis driven by fundamental data. Note that our analysis may not factor in the latest price-sensitive company announcements or qualitative material. Simply Wall St has no position in any stocks mentioned.
Join A Paid User Research Session
You’ll receive a US$30 Amazon Gift card for 1 hour of your time while helping us build better investing tools for the individual investors like yourself. Sign up here
