
 Yahoo Finance
 BigCommerce Holdings, Inc. (NASDAQ:BIGC): Is Breakeven Near?
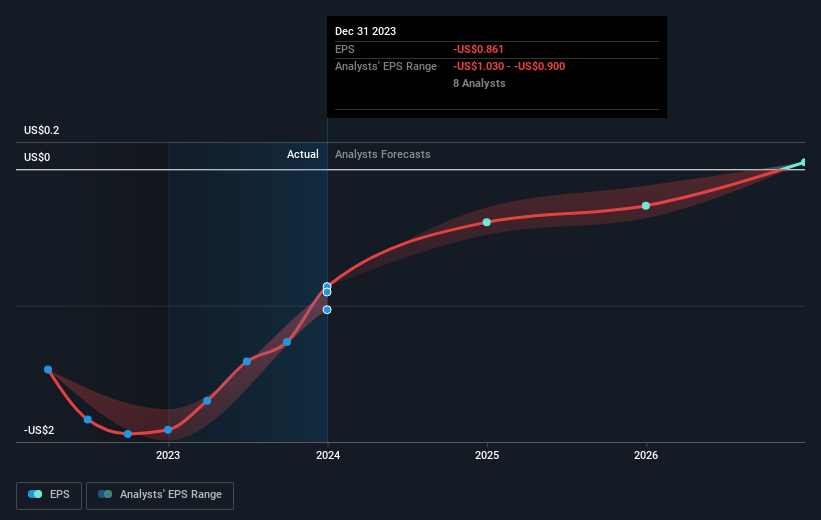
With the business potentially at an important milestone, we thought we'd take a closer look at BigCommerce Holdings, Inc.'s (NASDAQ:BIGC) future prospects. BigCommerce Holdings, Inc. operates a software-as-a-service platform for enterprises, small businesses, and mid-markets in the United States, North and South America, Europe, the Middle East, Africa, and the Asia–Pacific. On 31 December 2023, the US$575m market-cap company posted a loss of US$65m for its most recent financial year. Many investors are wondering about the rate at which BigCommerce Holdings will turn a profit, with the big question being “when will the company breakeven?” We've put together a brief outline of industry analyst expectations for the company, its year of breakeven and its implied growth rate.
Check out our latest analysis for BigCommerce Holdings
According to the 15 industry analysts covering BigCommerce Holdings, the consensus is that breakeven is near. They expect the company to post a final loss in 2025, before turning a profit of US$4.9m in 2026. So, the company is predicted to breakeven approximately 2 years from today. In order to meet this breakeven date, we calculated the rate at which the company must grow year-on-year. It turns out an average annual growth rate of 65% is expected, which signals high confidence from analysts. Should the business grow at a slower rate, it will become profitable at a later date than expected.
We're not going to go through company-specific developments for BigCommerce Holdings given that this is a high-level summary, but, bear in mind that typically a high forecast growth rate is not unusual for a company that is currently undergoing an investment period.
One thing we would like to bring into light with BigCommerce Holdings is its debt-to-equity ratio of over 2x. Generally, the rule of thumb is debt shouldn’t exceed 40% of your equity, and the company has considerably exceeded this. Note that a higher debt obligation increases the risk around investing in the loss-making company.
Next Steps:
This article is not intended to be a comprehensive analysis on BigCommerce Holdings, so if you are interested in understanding the company at a deeper level, take a look at BigCommerce Holdings' company page on Simply Wall St. We've also put together a list of essential factors you should look at:
Valuation: What is BigCommerce Holdings worth today? Has the future growth potential already been factored into the price? The intrinsic value infographic in our free research report helps visualize whether BigCommerce Holdings is currently mispriced by the market.
Management Team: An experienced management team on the helm increases our confidence in the business – take a look at who sits on BigCommerce Holdings’s board and the CEO’s background.
Other High-Performing Stocks: Are there other stocks that provide better prospects with proven track records? Explore our free list of these great stocks here.
Have feedback on this article? Concerned about the content? Get in touch with us directly. Alternatively, email editorial-team (at) simplywallst.com.
This article by Simply Wall St is general in nature. We provide commentary based on historical data and analyst forecasts only using an unbiased methodology and our articles are not intended to be financial advice. It does not constitute a recommendation to buy or sell any stock, and does not take account of your objectives, or your financial situation. We aim to bring you long-term focused analysis driven by fundamental data. Note that our analysis may not factor in the latest price-sensitive company announcements or qualitative material. Simply Wall St has no position in any stocks mentioned.
