
 Yahoo Finance
 Bitcoin forecast for the week of February 26, 2018, Technical Analysis
BTC/USD
Bitcoin markets initially tried to rally during the week, but then fell rather significantly to form a shooting star. The shooting star is a very negative candle, and I think that if we can break down below the bottom of that shooting star, the market is probably going to drop to the $8000 level. That’s an area that should be supportive, an area that is highlighted by not only the 61.8% Fibonacci retracement level, and of course the hammer that sits there as well should offer a bit of psychological support. I think if we break down below the $8000 level though, we probably go down to the $6000 level. A breakdown below that level would be catastrophic.
BTC/USD Video 26.02.18
Get Into Bitcoin Trading Today

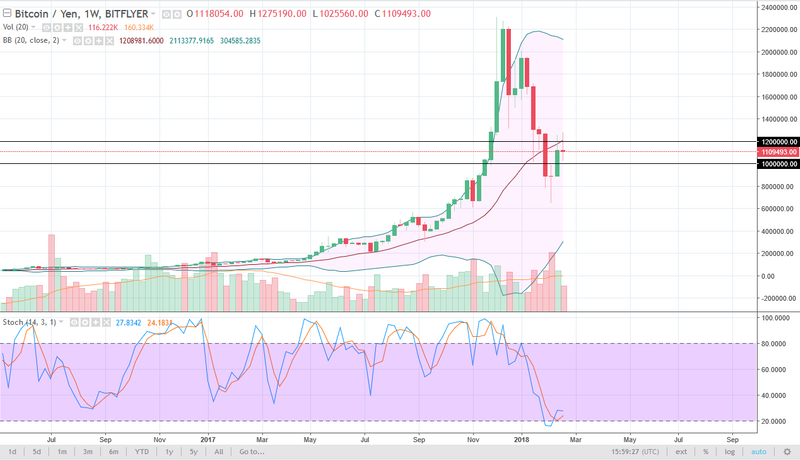
BTC/JPY
Bitcoin markets also tried to rally against the Japanese yen, but by the time that we closed down, we had formed a shooting star which is a negative sign. The ¥1 million level is between the hammer and the shooting star over the last couple of weeks. I think that we are going to at the very least go sideways, perhaps even break down. If we were to break down below the ¥700,000 level, the market will break down towards the 500,000 level, and then possibly the ¥400,000 level. Alternately, if we were to break above the shooting star for the week, then I think that the market can continue to go towards the ¥1.5 million level, perhaps even higher than that. This is 40% of the trading volume in the Bitcoin market, so pay attention to this market.
This article was originally posted on FX Empire
More From FXEMPIRE:
GBP/JPY forecast for the week of February 26, 2018, Technical Analysis
NZD/USD forecast for the week of February 26, 2018, Technical Analysis
Bitcoin forecast for the week of February 26, 2018, Technical Analysis
Technical Update For Gold, Silver & WTI Crude Oil: 23.02.2018
S&P 500 forecast for the week of February 26, 2018, Technical Analysis
GBP/USD forecast for the week of February 26, 2018, Technical Analysis
