
 Yahoo Finance
 Blackbird's (LON:BIRD) investors will be pleased with their impressive 179% return over the last three years
The last three months have been tough on Blackbird plc (LON:BIRD) shareholders, who have seen the share price decline a rather worrying 32%. In contrast, the return over three years has been impressive. In fact, the share price is up a full 179% compared to three years ago. It's not uncommon to see a share price retrace a bit, after a big gain. The thing to consider is whether the underlying business is doing well enough to support the current price.
Let's take a look at the underlying fundamentals over the longer term, and see if they've been consistent with shareholders returns.
Check out our latest analysis for Blackbird
Blackbird isn't currently profitable, so most analysts would look to revenue growth to get an idea of how fast the underlying business is growing. When a company doesn't make profits, we'd generally expect to see good revenue growth. That's because fast revenue growth can be easily extrapolated to forecast profits, often of considerable size.
In the last 3 years Blackbird saw its revenue grow at 27% per year. That's much better than most loss-making companies. Along the way, the share price gained 41% per year, a solid pop by our standards. This suggests the market has recognized the progress the business has made, at least to a significant degree. That's not to say we think the share price is too high. In fact, it might be worth keeping an eye on this one.
The company's revenue and earnings (over time) are depicted in the image below (click to see the exact numbers).
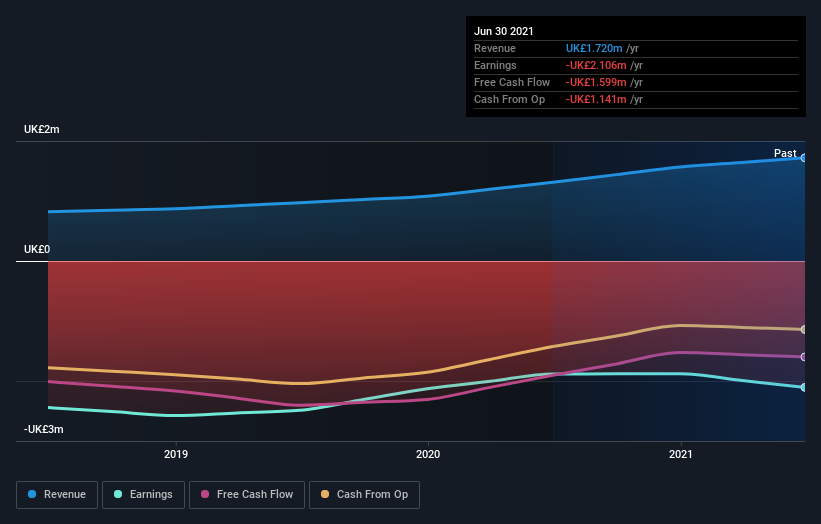
We like that insiders have been buying shares in the last twelve months. Having said that, most people consider earnings and revenue growth trends to be a more meaningful guide to the business. Dive deeper into the earnings by checking this interactive graph of Blackbird's earnings, revenue and cash flow.
A Different Perspective
Blackbird's TSR for the year was broadly in line with the market average, at 10%. We should note here that the five-year TSR is more impressive, at 17% per year. Although the share price growth has slowed, the longer term story points to a business well worth watching. It's always interesting to track share price performance over the longer term. But to understand Blackbird better, we need to consider many other factors. Case in point: We've spotted 3 warning signs for Blackbird you should be aware of.
If you like to buy stocks alongside management, then you might just love this free list of companies. (Hint: insiders have been buying them).
Please note, the market returns quoted in this article reflect the market weighted average returns of stocks that currently trade on GB exchanges.
Have feedback on this article? Concerned about the content? Get in touch with us directly. Alternatively, email editorial-team (at) simplywallst.com.
This article by Simply Wall St is general in nature. We provide commentary based on historical data and analyst forecasts only using an unbiased methodology and our articles are not intended to be financial advice. It does not constitute a recommendation to buy or sell any stock, and does not take account of your objectives, or your financial situation. We aim to bring you long-term focused analysis driven by fundamental data. Note that our analysis may not factor in the latest price-sensitive company announcements or qualitative material. Simply Wall St has no position in any stocks mentioned.
