
 Yahoo Finance
 Bombardier's (TSE:BBD.B) investors will be pleased with their favorable 34% return over the last year
These days it's easy to simply buy an index fund, and your returns should (roughly) match the market. But investors can boost returns by picking market-beating companies to own shares in. To wit, the Bombardier Inc. (TSE:BBD.B) share price is 34% higher than it was a year ago, much better than the market decline of around 6.7% (not including dividends) in the same period. That's a solid performance by our standards! However, the longer term returns haven't been so impressive, with the stock up just 11% in the last three years.
Now it's worth having a look at the company's fundamentals too, because that will help us determine if the long term shareholder return has matched the performance of the underlying business.
Check out our latest analysis for Bombardier
Bombardier wasn't profitable in the last twelve months, it is unlikely we'll see a strong correlation between its share price and its earnings per share (EPS). Arguably revenue is our next best option. When a company doesn't make profits, we'd generally expect to see good revenue growth. That's because it's hard to be confident a company will be sustainable if revenue growth is negligible, and it never makes a profit.
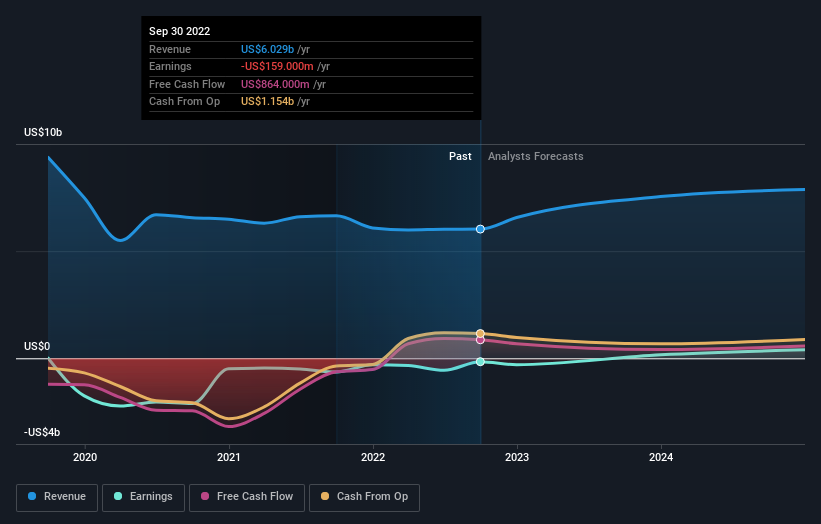
In the last year Bombardier saw its revenue shrink by 9.4%. The stock is up 34% in that time, a fine performance given the revenue drop. We can correlate the share price rise with revenue or profit growth, but it seems the market had previously expected weaker results, and sentiment around the stock is improving.
The company's revenue and earnings (over time) are depicted in the image below (click to see the exact numbers).
Bombardier is a well known stock, with plenty of analyst coverage, suggesting some visibility into future growth. If you are thinking of buying or selling Bombardier stock, you should check out this free report showing analyst consensus estimates for future profits.
A Different Perspective
It's nice to see that Bombardier shareholders have received a total shareholder return of 34% over the last year. Notably the five-year annualised TSR loss of 5% per year compares very unfavourably with the recent share price performance. We generally put more weight on the long term performance over the short term, but the recent improvement could hint at a (positive) inflection point within the business. I find it very interesting to look at share price over the long term as a proxy for business performance. But to truly gain insight, we need to consider other information, too. Consider for instance, the ever-present spectre of investment risk. We've identified 1 warning sign with Bombardier , and understanding them should be part of your investment process.
But note: Bombardier may not be the best stock to buy. So take a peek at this free list of interesting companies with past earnings growth (and further growth forecast).
Please note, the market returns quoted in this article reflect the market weighted average returns of stocks that currently trade on CA exchanges.
Have feedback on this article? Concerned about the content? Get in touch with us directly. Alternatively, email editorial-team (at) simplywallst.com.
This article by Simply Wall St is general in nature. We provide commentary based on historical data and analyst forecasts only using an unbiased methodology and our articles are not intended to be financial advice. It does not constitute a recommendation to buy or sell any stock, and does not take account of your objectives, or your financial situation. We aim to bring you long-term focused analysis driven by fundamental data. Note that our analysis may not factor in the latest price-sensitive company announcements or qualitative material. Simply Wall St has no position in any stocks mentioned.
Join A Paid User Research Session
You’ll receive a US$30 Amazon Gift card for 1 hour of your time while helping us build better investing tools for the individual investors like yourself. Sign up here
