
 Yahoo Finance
 What Is boohoo group's (LON:BOO) P/E Ratio After Its Share Price Tanked?

Unfortunately for some shareholders, the boohoo group (LON:BOO) share price has dived 31% in the last thirty days. The stock has been solid, longer term, gaining 23% in the last year.
Assuming nothing else has changed, a lower share price makes a stock more attractive to potential buyers. In the long term, share prices tend to follow earnings per share, but in the short term prices bounce around in response to short term factors (which are not always obvious). The implication here is that long term investors have an opportunity when expectations of a company are too low. One way to gauge market expectations of a stock is to look at its Price to Earnings Ratio (PE Ratio). A high P/E implies that investors have high expectations of what a company can achieve compared to a company with a low P/E ratio.
Check out our latest analysis for boohoo group
Does boohoo group Have A Relatively High Or Low P/E For Its Industry?
We can tell from its P/E ratio of 50.69 that there is some investor optimism about boohoo group. You can see in the image below that the average P/E (14.2) for companies in the online retail industry is a lot lower than boohoo group's P/E.
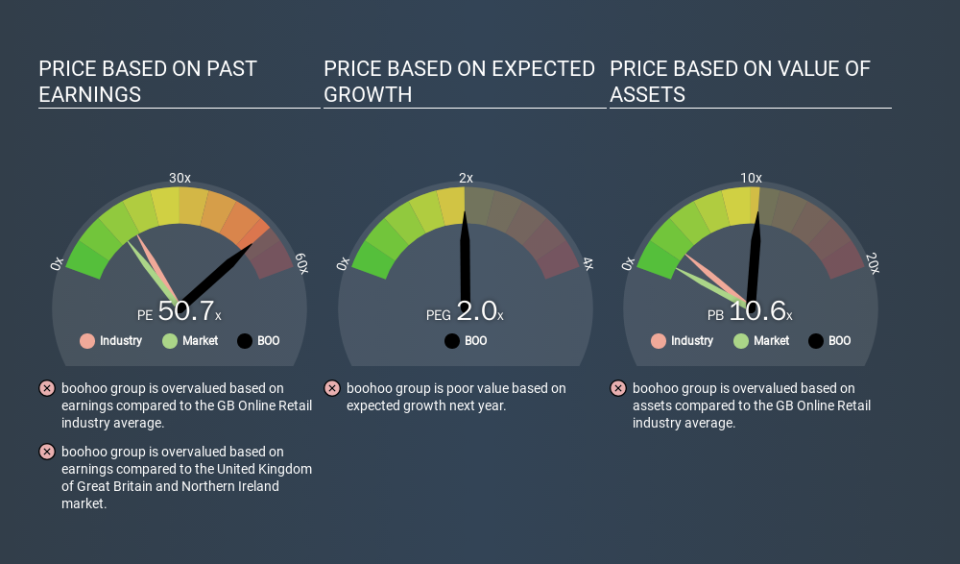
boohoo group's P/E tells us that market participants think the company will perform better than its industry peers, going forward. The market is optimistic about the future, but that doesn't guarantee future growth. So investors should always consider the P/E ratio alongside other factors, such as whether company directors have been buying shares.
How Growth Rates Impact P/E Ratios
Generally speaking the rate of earnings growth has a profound impact on a company's P/E multiple. That's because companies that grow earnings per share quickly will rapidly increase the 'E' in the equation. That means unless the share price increases, the P/E will reduce in a few years. A lower P/E should indicate the stock is cheap relative to others -- and that may attract buyers.
boohoo group increased earnings per share by a whopping 49% last year. And it has bolstered its earnings per share by 41% per year over the last five years. So we'd generally expect it to have a relatively high P/E ratio.
Remember: P/E Ratios Don't Consider The Balance Sheet
One drawback of using a P/E ratio is that it considers market capitalization, but not the balance sheet. In other words, it does not consider any debt or cash that the company may have on the balance sheet. Hypothetically, a company could reduce its future P/E ratio by spending its cash (or taking on debt) to achieve higher earnings.
Such expenditure might be good or bad, in the long term, but the point here is that the balance sheet is not reflected by this ratio.
How Does boohoo group's Debt Impact Its P/E Ratio?
Since boohoo group holds net cash of UK£207m, it can spend on growth, justifying a higher P/E ratio than otherwise.
The Verdict On boohoo group's P/E Ratio
With a P/E ratio of 50.7, boohoo group is expected to grow earnings very strongly in the years to come. The excess cash it carries is the gravy on top its fast EPS growth. So based on this analysis we'd expect boohoo group to have a high P/E ratio. What can be absolutely certain is that the market has become significantly less optimistic about boohoo group over the last month, with the P/E ratio falling from 73.0 back then to 50.7 today. For those who prefer to invest with the flow of momentum, that might be a bad sign, but for a contrarian, it may signal opportunity.
Investors should be looking to buy stocks that the market is wrong about. If the reality for a company is better than it expects, you can make money by buying and holding for the long term. So this free visualization of the analyst consensus on future earnings could help you make the right decision about whether to buy, sell, or hold.
Of course you might be able to find a better stock than boohoo group. So you may wish to see this free collection of other companies that have grown earnings strongly.
If you spot an error that warrants correction, please contact the editor at editorial-team@simplywallst.com. This article by Simply Wall St is general in nature. It does not constitute a recommendation to buy or sell any stock, and does not take account of your objectives, or your financial situation. Simply Wall St has no position in the stocks mentioned.
We aim to bring you long-term focused research analysis driven by fundamental data. Note that our analysis may not factor in the latest price-sensitive company announcements or qualitative material. Thank you for reading.
