
 Yahoo Finance
 Brook Crompton Holdings (SGX:AWC) May Have Issues Allocating Its Capital
If you're looking for a multi-bagger, there's a few things to keep an eye out for. Ideally, a business will show two trends; firstly a growing return on capital employed (ROCE) and secondly, an increasing amount of capital employed. This shows us that it's a compounding machine, able to continually reinvest its earnings back into the business and generate higher returns. Having said that, from a first glance at Brook Crompton Holdings (SGX:AWC) we aren't jumping out of our chairs at how returns are trending, but let's have a deeper look.
Understanding Return On Capital Employed (ROCE)
Just to clarify if you're unsure, ROCE is a metric for evaluating how much pre-tax income (in percentage terms) a company earns on the capital invested in its business. Analysts use this formula to calculate it for Brook Crompton Holdings:
Return on Capital Employed = Earnings Before Interest and Tax (EBIT) ÷ (Total Assets - Current Liabilities)
0.088 = S$4.1m ÷ (S$66m - S$20m) (Based on the trailing twelve months to December 2023).
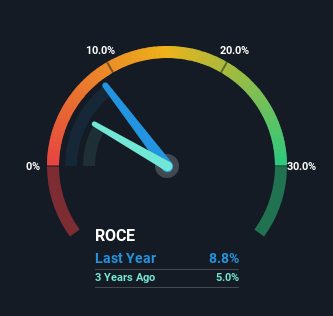
So, Brook Crompton Holdings has an ROCE of 8.8%. In absolute terms, that's a low return but it's around the Trade Distributors industry average of 7.5%.
View our latest analysis for Brook Crompton Holdings
While the past is not representative of the future, it can be helpful to know how a company has performed historically, which is why we have this chart above. If you'd like to look at how Brook Crompton Holdings has performed in the past in other metrics, you can view this free graph of Brook Crompton Holdings' past earnings, revenue and cash flow.
What Does the ROCE Trend For Brook Crompton Holdings Tell Us?
In terms of Brook Crompton Holdings' historical ROCE movements, the trend isn't fantastic. Around five years ago the returns on capital were 12%, but since then they've fallen to 8.8%. However, given capital employed and revenue have both increased it appears that the business is currently pursuing growth, at the consequence of short term returns. If these investments prove successful, this can bode very well for long term stock performance.
What We Can Learn From Brook Crompton Holdings' ROCE
While returns have fallen for Brook Crompton Holdings in recent times, we're encouraged to see that sales are growing and that the business is reinvesting in its operations. These trends don't appear to have influenced returns though, because the total return from the stock has been mostly flat over the last five years. So we think it'd be worthwhile to look further into this stock given the trends look encouraging.
If you want to know some of the risks facing Brook Crompton Holdings we've found 3 warning signs (1 can't be ignored!) that you should be aware of before investing here.
If you want to search for solid companies with great earnings, check out this free list of companies with good balance sheets and impressive returns on equity.
Have feedback on this article? Concerned about the content? Get in touch with us directly. Alternatively, email editorial-team (at) simplywallst.com.
This article by Simply Wall St is general in nature. We provide commentary based on historical data and analyst forecasts only using an unbiased methodology and our articles are not intended to be financial advice. It does not constitute a recommendation to buy or sell any stock, and does not take account of your objectives, or your financial situation. We aim to bring you long-term focused analysis driven by fundamental data. Note that our analysis may not factor in the latest price-sensitive company announcements or qualitative material. Simply Wall St has no position in any stocks mentioned.
Have feedback on this article? Concerned about the content? Get in touch with us directly. Alternatively, email editorial-team@simplywallst.com
