
 Yahoo Finance
 Brown-Forman (BF.B) Q4 Earnings Beat Estimates, Sales Fall Y/Y
Brown-Forman Corporation (BF.B) reported mixed fourth-quarter fiscal 2024 results. The company’s earnings beat the Zacks Consensus Estimate and improved year over year. Meanwhile, sales missed the consensus estimate and declined year over year.
In the fiscal fourth quarter, earnings per share of 56 cents rose 31% year over year and beat the consensus estimate of 42 cents.
Net sales of $964 million missed the Zacks Consensus Estimate of $1.03 billion. The top line decreased 8% year over year on a reported basis. On an organic basis, net sales were down 5% from the prior-year level.
Shares of Brown-Forman dipped 4.9% in the pre-market trading session on Mar 6, owing to the soft top-line performance and a lowered view for fiscal 2024. The Zacks Rank #4 (Sell) company’s shares have lost 21.2% in the past three months compared with the industry’s 7.2% decline.
Q4 in Detail
In the fourth quarter, Brown-Forman’s gross profit of $569 million fell 10% year over year on a reported basis and 8% on an organic basis. The gross margin contracted 170 basis points to 59%.
Brown-Forman Corporation Price, Consensus and EPS Surprise
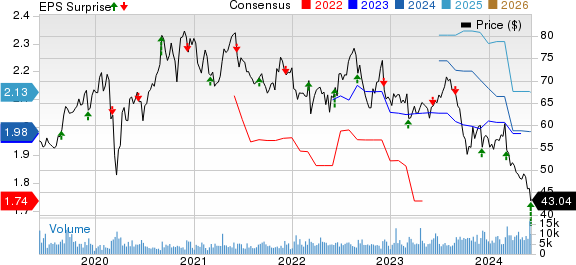
Brown-Forman Corporation price-consensus-eps-surprise-chart | Brown-Forman Corporation Quote
SG&A expenses of $231 million rose 14% year over year and 4% on an organic basis. The increase stemmed from higher compensation and benefit-related expenses. Advertising expenses decreased 14% year over year to $115 million. On an organic basis, advertising expenses declined 12%.
We expected advertising expenses to increase 3.4% year over year to $138.6 million and selling, general and administrative expenses to rise 4.7% year over year to $210.4 million.
Operating income improved 26% year over year to $375 million on a reported basis. The organic operating income fell 16%. The operating margin of 38.9% expanded from 28.5% reported in the year-ago quarter.
Our model predicted an operating margin of 27.6%, which indicated a decline of 28.5% from the year-ago quarter.
Market-Wise Performance
In fiscal 2024, net sales dipped 4% both on a reported basis and an organic basis in the United States, driven by fewer volumes. This downside was partly offset by increased prices across the portfolio, led by el Jimador and Woodford Reserve, and growth in superpremium Jack Daniel’s expressions like Jack Daniel’s Single Barrel Rye Barrel Proof and Jack Daniel's Sinatra.
The developed International markets registered a net sales drop of 2% year over year and 5% on an organic basis, owing to the lower volumes of Jack Daniel’s Tennessee Whiskey in Japan, following an inventory build in the second half of the earlier fiscal year. This was somewhat offset by growth in Diplomático and Gin Mare, and Glenglassaugh old and rare cask sales.
The Travel Retail channel’s net sales rose 8% on a reported basis and 6% on an organic basis, backed by the super-premium American whiskey portfolio. Woodford Reserve and the launch of Jack Daniel’s American Single Malt were the huge contributors to the channel.
The emerging markets’ net sales grew 5% on a reported basis and 8% on an organic basis led by solid growth of New Mix in Mexico and Jack Daniel’s Tennessee Apple in Brazil. This increase was partly offset by Jack Daniel’s Tennessee Whiskey decreases in the United Arab Emirates and Sub-Saharan Africa.
Category-Wise Performance
In fiscal 2024, the company’s newly acquired Gin Mare and Diplomático drove most of the sales growth. This led to significant growth in the rest of the portfolio, with a reported sales increase of 61% and organic sales growth of 15%. The improvement was driven by gains in the emerging markets and the Travel Retail channel.
The company continued to witness growth in the ready-to-drink (RTD) category, owing to consumer preference for convenience and flavor. Sales for New Mix improved 32% on a reported basis and 17% on an organic basis, driven by higher prices. Jack Daniel’s RTDs/Ready-to-Pours reported a sales drop of 6% on a reported and 5% on an organic basis, driven by fewer volumes of Jack Daniel’s & Coca-Cola RTD, partly offset by the launch of the Jack Daniel’s & Coca-Cola RTD.
Net sales for Whiskey products declined 3% year over year and 2% on an organic basis. The dip was led by declines in Jack Daniel’s Tennessee Whiskey and Jack Daniel’s Tennessee Honey, offset by growth of Jack Daniel’s Tennessee Apple and the rest of the whiskey portfolio, including Jack Daniel’s super-premium expressions, and Glenglassaugh old and rare cask sales.
Brown-Forman’s reported sales for the tequila portfolio were down 4% year over year, with a 7% decline on an organic basis. The el Jimador reported sales, which were flat year over year and down 1% on an organic basis, led by lower volumes in Mexico and the United States, offset by increased prices. Sales declined 10% on a reported and 13% on an organic basis for the Herradura brand, driven by lower volumes in the United States.
Balance Sheet & Cash Flow
The company ended fourth-quarter fiscal 2024 with cash and cash equivalents of $446 million and long-term debt of $2.4 billion. Its total shareholders’ equity was $3.5 billion. As of Apr 30, BF.B had $640 million in cash from operating activities.
In fiscal 2024, the company returned nearly $804 million to stockholders including $404 million via dividends and $400 million via share repurchases. It has paid out regular quarterly dividends for 80 consecutive years and raised the dividend for 40 consecutive years.
Outlook
In fiscal 2025, management anticipates a return to growth for organic net sales and organic operating income, backed by gains in the international markets and the benefit of normalizing inventory trends. The company projects organic net sales growth in the range of 2-4%.
Brown-Forman expects the organic operating income to be between 2% and 4%. The effective tax rate is expected to be in the band of 21-23%. Capital expenditure is anticipated to be in the range of $195-$205 million.
Stocks to Consider
The Chef’s Warehouse CHEF, which engages in the distribution of specialty food products, currently carries a Zacks Rank #2 (Buy). CHEF has a trailing four-quarter earnings surprise of 23.4%, on average. You can see the complete list of today’s Zacks #1 Rank (Strong Buy) stocks here.
The Zacks Consensus Estimate for The Chef’s Warehouse’s current fiscal year sales and earnings indicates growth of 9.5% and 7.9%, respectively, from the year-ago reported numbers.
Vital Farms Inc. VITL offers a range of produced pasture-raised foods. It currently carries a Zacks Rank of 2. VITL has a trailing four-quarter average earnings surprise of 102.1%.
The consensus estimate for Vital Farms’ current financial-year sales and earnings implies growth of 17.2% and 37.3%, respectively, from the year-ago reported numbers.
Utz Brands Inc. UTZ, which manufactures a diverse portfolio of salty snacks, currently carries a Zacks Rank of 2. UTZ has a trailing four-quarter earnings surprise of 2%, on average.
The Zacks Consensus Estimate for Utz Brands’ current financial-year earnings indicates growth of 24.6% from the year-ago reported numbers.
Want the latest recommendations from Zacks Investment Research? Today, you can download 7 Best Stocks for the Next 30 Days. Click to get this free report
Brown-Forman Corporation (BF.B) : Free Stock Analysis Report
The Chefs' Warehouse, Inc. (CHEF) : Free Stock Analysis Report
Vital Farms, Inc. (VITL) : Free Stock Analysis Report
Utz Brands, Inc. (UTZ) : Free Stock Analysis Report
