
 Yahoo Finance
 C.H. Robinson Worldwide (NASDAQ:CHRW) Could Be At Risk Of Shrinking As A Company
When it comes to investing, there are some useful financial metrics that can warn us when a business is potentially in trouble. Businesses in decline often have two underlying trends, firstly, a declining return on capital employed (ROCE) and a declining base of capital employed. This combination can tell you that not only is the company investing less, it's earning less on what it does invest. So after glancing at the trends within C.H. Robinson Worldwide (NASDAQ:CHRW), we weren't too hopeful.
Understanding Return On Capital Employed (ROCE)
For those who don't know, ROCE is a measure of a company's yearly pre-tax profit (its return), relative to the capital employed in the business. The formula for this calculation on C.H. Robinson Worldwide is:
Return on Capital Employed = Earnings Before Interest and Tax (EBIT) ÷ (Total Assets - Current Liabilities)
0.16 = US$511m ÷ (US$5.5b - US$2.3b) (Based on the trailing twelve months to March 2024).
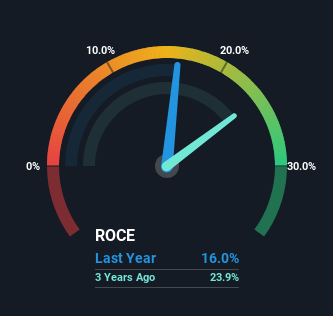
So, C.H. Robinson Worldwide has an ROCE of 16%. In absolute terms, that's a satisfactory return, but compared to the Logistics industry average of 10% it's much better.
View our latest analysis for C.H. Robinson Worldwide
Above you can see how the current ROCE for C.H. Robinson Worldwide compares to its prior returns on capital, but there's only so much you can tell from the past. If you'd like to see what analysts are forecasting going forward, you should check out our free analyst report for C.H. Robinson Worldwide .
What Does the ROCE Trend For C.H. Robinson Worldwide Tell Us?
There is reason to be cautious about C.H. Robinson Worldwide, given the returns are trending downwards. Unfortunately the returns on capital have diminished from the 29% that they were earning five years ago. Meanwhile, capital employed in the business has stayed roughly the flat over the period. Companies that exhibit these attributes tend to not be shrinking, but they can be mature and facing pressure on their margins from competition. So because these trends aren't typically conducive to creating a multi-bagger, we wouldn't hold our breath on C.H. Robinson Worldwide becoming one if things continue as they have.
On a side note, C.H. Robinson Worldwide's current liabilities have increased over the last five years to 42% of total assets, effectively distorting the ROCE to some degree. Without this increase, it's likely that ROCE would be even lower than 16%. What this means is that in reality, a rather large portion of the business is being funded by the likes of the company's suppliers or short-term creditors, which can bring some risks of its own.
The Key Takeaway
All in all, the lower returns from the same amount of capital employed aren't exactly signs of a compounding machine. Investors must expect better things on the horizon though because the stock has risen 17% in the last five years. Regardless, we don't like the trends as they are and if they persist, we think you might find better investments elsewhere.
If you'd like to know about the risks facing C.H. Robinson Worldwide, we've discovered 3 warning signs that you should be aware of.
While C.H. Robinson Worldwide isn't earning the highest return, check out this free list of companies that are earning high returns on equity with solid balance sheets.
Have feedback on this article? Concerned about the content? Get in touch with us directly. Alternatively, email editorial-team (at) simplywallst.com.
This article by Simply Wall St is general in nature. We provide commentary based on historical data and analyst forecasts only using an unbiased methodology and our articles are not intended to be financial advice. It does not constitute a recommendation to buy or sell any stock, and does not take account of your objectives, or your financial situation. We aim to bring you long-term focused analysis driven by fundamental data. Note that our analysis may not factor in the latest price-sensitive company announcements or qualitative material. Simply Wall St has no position in any stocks mentioned.
Have feedback on this article? Concerned about the content? Get in touch with us directly. Alternatively, email editorial-team@simplywallst.com
