
 Yahoo Finance
 Cake Box Holdings (LON:CBOX) Will Be Hoping To Turn Its Returns On Capital Around
If we want to find a potential multi-bagger, often there are underlying trends that can provide clues. In a perfect world, we'd like to see a company investing more capital into its business and ideally the returns earned from that capital are also increasing. Ultimately, this demonstrates that it's a business that is reinvesting profits at increasing rates of return. So when we looked at Cake Box Holdings (LON:CBOX), they do have a high ROCE, but we weren't exactly elated from how returns are trending.
Understanding Return On Capital Employed (ROCE)
For those that aren't sure what ROCE is, it measures the amount of pre-tax profits a company can generate from the capital employed in its business. To calculate this metric for Cake Box Holdings, this is the formula:
Return on Capital Employed = Earnings Before Interest and Tax (EBIT) ÷ (Total Assets - Current Liabilities)
0.33 = UK£7.0m ÷ (UK£26m - UK£4.2m) (Based on the trailing twelve months to March 2022).
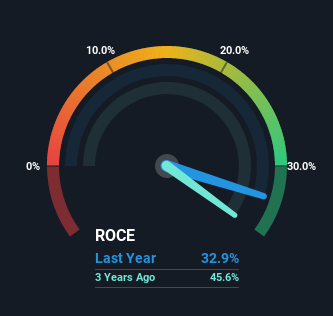
So, Cake Box Holdings has an ROCE of 33%. That's a fantastic return and not only that, it outpaces the average of 9.2% earned by companies in a similar industry.
View our latest analysis for Cake Box Holdings
Above you can see how the current ROCE for Cake Box Holdings compares to its prior returns on capital, but there's only so much you can tell from the past. If you'd like, you can check out the forecasts from the analysts covering Cake Box Holdings here for free.
So How Is Cake Box Holdings' ROCE Trending?
On the surface, the trend of ROCE at Cake Box Holdings doesn't inspire confidence. While it's comforting that the ROCE is high, five years ago it was 46%. Although, given both revenue and the amount of assets employed in the business have increased, it could suggest the company is investing in growth, and the extra capital has led to a short-term reduction in ROCE. If these investments prove successful, this can bode very well for long term stock performance.
On a side note, Cake Box Holdings has done well to pay down its current liabilities to 16% of total assets. So we could link some of this to the decrease in ROCE. Effectively this means their suppliers or short-term creditors are funding less of the business, which reduces some elements of risk. Some would claim this reduces the business' efficiency at generating ROCE since it is now funding more of the operations with its own money.
The Key Takeaway
In summary, despite lower returns in the short term, we're encouraged to see that Cake Box Holdings is reinvesting for growth and has higher sales as a result. These trends are starting to be recognized by investors since the stock has delivered a 13% gain to shareholders who've held over the last three years. Therefore we'd recommend looking further into this stock to confirm if it has the makings of a good investment.
Cake Box Holdings does come with some risks though, we found 3 warning signs in our investment analysis, and 1 of those is a bit unpleasant...
High returns are a key ingredient to strong performance, so check out our free list ofstocks earning high returns on equity with solid balance sheets.
Have feedback on this article? Concerned about the content? Get in touch with us directly. Alternatively, email editorial-team (at) simplywallst.com.
This article by Simply Wall St is general in nature. We provide commentary based on historical data and analyst forecasts only using an unbiased methodology and our articles are not intended to be financial advice. It does not constitute a recommendation to buy or sell any stock, and does not take account of your objectives, or your financial situation. We aim to bring you long-term focused analysis driven by fundamental data. Note that our analysis may not factor in the latest price-sensitive company announcements or qualitative material. Simply Wall St has no position in any stocks mentioned.
