
 Yahoo Finance
 Is CalAmp Corp. (NASDAQ:CAMP) Investing Your Capital Efficiently?

Today we'll look at CalAmp Corp. (NASDAQ:CAMP) and reflect on its potential as an investment. In particular, we'll consider its Return On Capital Employed (ROCE), as that can give us insight into how profitably the company is able to employ capital in its business.
First of all, we'll work out how to calculate ROCE. Second, we'll look at its ROCE compared to similar companies. Finally, we'll look at how its current liabilities affect its ROCE.
Return On Capital Employed (ROCE): What is it?
ROCE measures the amount of pre-tax profits a company can generate from the capital employed in its business. All else being equal, a better business will have a higher ROCE. In brief, it is a useful tool, but it is not without drawbacks. Renowned investment researcher Michael Mauboussin has suggested that a high ROCE can indicate that 'one dollar invested in the company generates value of more than one dollar'.
So, How Do We Calculate ROCE?
The formula for calculating the return on capital employed is:
Return on Capital Employed = Earnings Before Interest and Tax (EBIT) ÷ (Total Assets - Current Liabilities)
Or for CalAmp:
0.046 = US$20m ÷ (US$652m - US$212m) (Based on the trailing twelve months to May 2019.)
So, CalAmp has an ROCE of 4.6%.
See our latest analysis for CalAmp
Is CalAmp's ROCE Good?
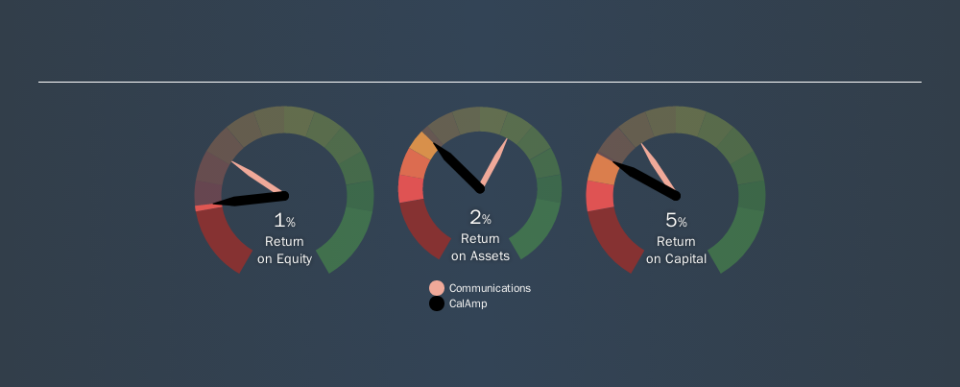
One way to assess ROCE is to compare similar companies. We can see CalAmp's ROCE is meaningfully below the Communications industry average of 6.6%. This performance could be negative if sustained, as it suggests the business may underperform its industry. Independently of how CalAmp compares to its industry, its ROCE in absolute terms is low; especially compared to the ~2.7% available in government bonds. It is likely that there are more attractive prospects out there.
CalAmp's current ROCE of 4.6% is lower than 3 years ago, when the company reported a 8.0% ROCE. So investors might consider if it has had issues recently. You can see in the image below how CalAmp's ROCE compares to its industry. Click to see more on past growth.
When considering ROCE, bear in mind that it reflects the past and does not necessarily predict the future. Companies in cyclical industries can be difficult to understand using ROCE, as returns typically look high during boom times, and low during busts. This is because ROCE only looks at one year, instead of considering returns across a whole cycle. What happens in the future is pretty important for investors, so we have prepared a free report on analyst forecasts for CalAmp.
Do CalAmp's Current Liabilities Skew Its ROCE?
Liabilities, such as supplier bills and bank overdrafts, are referred to as current liabilities if they need to be paid within 12 months. Due to the way the ROCE equation works, having large bills due in the near term can make it look as though a company has less capital employed, and thus a higher ROCE than usual. To counteract this, we check if a company has high current liabilities, relative to its total assets.
CalAmp has total assets of US$652m and current liabilities of US$212m. Therefore its current liabilities are equivalent to approximately 33% of its total assets. With a medium level of current liabilities boosting the ROCE a little, CalAmp's low ROCE is unappealing.
What We Can Learn From CalAmp's ROCE
There are likely better investments out there. Of course, you might also be able to find a better stock than CalAmp. So you may wish to see this free collection of other companies that have grown earnings strongly.
For those who like to find winning investments this free list of growing companies with recent insider purchasing, could be just the ticket.
We aim to bring you long-term focused research analysis driven by fundamental data. Note that our analysis may not factor in the latest price-sensitive company announcements or qualitative material.
If you spot an error that warrants correction, please contact the editor at editorial-team@simplywallst.com. This article by Simply Wall St is general in nature. It does not constitute a recommendation to buy or sell any stock, and does not take account of your objectives, or your financial situation. Simply Wall St has no position in the stocks mentioned. Thank you for reading.
