
 Yahoo Finance
 Calculating The Fair Value Of Byrna Technologies Inc. (NASDAQ:BYRN)
Key Insights
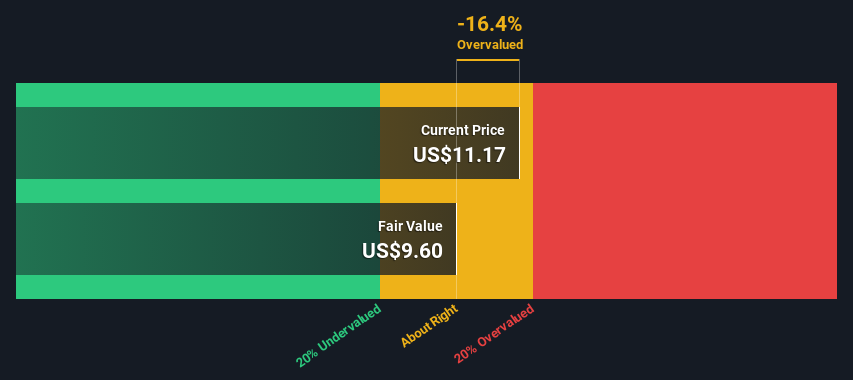
Using the 2 Stage Free Cash Flow to Equity, Byrna Technologies fair value estimate is US$9.60
Byrna Technologies' US$11.17 share price indicates it is trading at similar levels as its fair value estimate
Does the May share price for Byrna Technologies Inc. (NASDAQ:BYRN) reflect what it's really worth? Today, we will estimate the stock's intrinsic value by estimating the company's future cash flows and discounting them to their present value. This will be done using the Discounted Cash Flow (DCF) model. Models like these may appear beyond the comprehension of a lay person, but they're fairly easy to follow.
Companies can be valued in a lot of ways, so we would point out that a DCF is not perfect for every situation. If you still have some burning questions about this type of valuation, take a look at the Simply Wall St analysis model.
See our latest analysis for Byrna Technologies
Step By Step Through The Calculation
We use what is known as a 2-stage model, which simply means we have two different periods of growth rates for the company's cash flows. Generally the first stage is higher growth, and the second stage is a lower growth phase. To start off with, we need to estimate the next ten years of cash flows. Where possible we use analyst estimates, but when these aren't available we extrapolate the previous free cash flow (FCF) from the last estimate or reported value. We assume companies with shrinking free cash flow will slow their rate of shrinkage, and that companies with growing free cash flow will see their growth rate slow, over this period. We do this to reflect that growth tends to slow more in the early years than it does in later years.
A DCF is all about the idea that a dollar in the future is less valuable than a dollar today, so we discount the value of these future cash flows to their estimated value in today's dollars:
10-year free cash flow (FCF) estimate
2024 | 2025 | 2026 | 2027 | 2028 | 2029 | 2030 | 2031 | 2032 | 2033 | |
Levered FCF ($, Millions) | US$6.38m | US$5.62m | US$9.11m | US$9.21m | US$9.35m | US$9.51m | US$9.70m | US$9.90m | US$10.1m | US$10.3m |
Growth Rate Estimate Source | Analyst x1 | Analyst x1 | Analyst x1 | Est @ 1.10% | Est @ 1.48% | Est @ 1.75% | Est @ 1.94% | Est @ 2.07% | Est @ 2.16% | Est @ 2.23% |
Present Value ($, Millions) Discounted @ 6.1% | US$6.0 | US$5.0 | US$7.6 | US$7.3 | US$6.9 | US$6.7 | US$6.4 | US$6.1 | US$5.9 | US$5.7 |
("Est" = FCF growth rate estimated by Simply Wall St)
Present Value of 10-year Cash Flow (PVCF) = US$64m
We now need to calculate the Terminal Value, which accounts for all the future cash flows after this ten year period. The Gordon Growth formula is used to calculate Terminal Value at a future annual growth rate equal to the 5-year average of the 10-year government bond yield of 2.4%. We discount the terminal cash flows to today's value at a cost of equity of 6.1%.
Terminal Value (TV)= FCF2033 × (1 + g) ÷ (r – g) = US$10m× (1 + 2.4%) ÷ (6.1%– 2.4%) = US$281m
Present Value of Terminal Value (PVTV)= TV / (1 + r)10= US$281m÷ ( 1 + 6.1%)10= US$155m
The total value, or equity value, is then the sum of the present value of the future cash flows, which in this case is US$218m. To get the intrinsic value per share, we divide this by the total number of shares outstanding. Compared to the current share price of US$11.2, the company appears around fair value at the time of writing. The assumptions in any calculation have a big impact on the valuation, so it is better to view this as a rough estimate, not precise down to the last cent.
The Assumptions
We would point out that the most important inputs to a discounted cash flow are the discount rate and of course the actual cash flows. Part of investing is coming up with your own evaluation of a company's future performance, so try the calculation yourself and check your own assumptions. The DCF also does not consider the possible cyclicality of an industry, or a company's future capital requirements, so it does not give a full picture of a company's potential performance. Given that we are looking at Byrna Technologies as potential shareholders, the cost of equity is used as the discount rate, rather than the cost of capital (or weighted average cost of capital, WACC) which accounts for debt. In this calculation we've used 6.1%, which is based on a levered beta of 0.819. Beta is a measure of a stock's volatility, compared to the market as a whole. We get our beta from the industry average beta of globally comparable companies, with an imposed limit between 0.8 and 2.0, which is a reasonable range for a stable business.
SWOT Analysis for Byrna Technologies
Strength
Currently debt free.
Weakness
Expensive based on P/S ratio and estimated fair value.
Shareholders have been diluted in the past year.
Opportunity
Expected to breakeven next year.
Has sufficient cash runway for more than 3 years based on current free cash flows.
Threat
No apparent threats visible for BYRN.
Moving On:
Valuation is only one side of the coin in terms of building your investment thesis, and it ideally won't be the sole piece of analysis you scrutinize for a company. DCF models are not the be-all and end-all of investment valuation. Rather it should be seen as a guide to "what assumptions need to be true for this stock to be under/overvalued?" If a company grows at a different rate, or if its cost of equity or risk free rate changes sharply, the output can look very different. For Byrna Technologies, there are three fundamental items you should assess:
Risks: For instance, we've identified 2 warning signs for Byrna Technologies that you should be aware of.
Management:Have insiders been ramping up their shares to take advantage of the market's sentiment for BYRN's future outlook? Check out our management and board analysis with insights on CEO compensation and governance factors.
Other Solid Businesses: Low debt, high returns on equity and good past performance are fundamental to a strong business. Why not explore our interactive list of stocks with solid business fundamentals to see if there are other companies you may not have considered!
PS. The Simply Wall St app conducts a discounted cash flow valuation for every stock on the NASDAQCM every day. If you want to find the calculation for other stocks just search here.
Have feedback on this article? Concerned about the content? Get in touch with us directly. Alternatively, email editorial-team (at) simplywallst.com.
This article by Simply Wall St is general in nature. We provide commentary based on historical data and analyst forecasts only using an unbiased methodology and our articles are not intended to be financial advice. It does not constitute a recommendation to buy or sell any stock, and does not take account of your objectives, or your financial situation. We aim to bring you long-term focused analysis driven by fundamental data. Note that our analysis may not factor in the latest price-sensitive company announcements or qualitative material. Simply Wall St has no position in any stocks mentioned.
