
 Yahoo Finance
 Calculating The Fair Value Of Saferoads Holdings Limited (ASX:SRH)
Key Insights
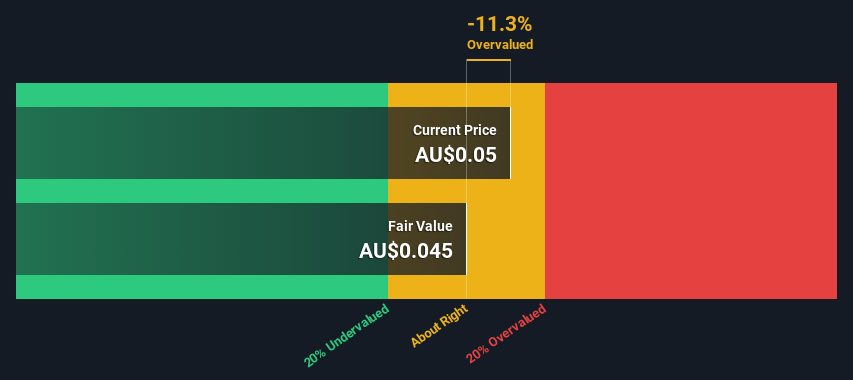
Using the 2 Stage Free Cash Flow to Equity, Saferoads Holdings fair value estimate is AU$0.045
Current share price of AU$0.05 suggests Saferoads Holdings is potentially trading close to its fair value
When compared to theindustry average discount of -28%, Saferoads Holdings' competitors seem to be trading at a greater premium to fair value
Today we will run through one way of estimating the intrinsic value of Saferoads Holdings Limited (ASX:SRH) by estimating the company's future cash flows and discounting them to their present value. Our analysis will employ the Discounted Cash Flow (DCF) model. It may sound complicated, but actually it is quite simple!
We generally believe that a company's value is the present value of all of the cash it will generate in the future. However, a DCF is just one valuation metric among many, and it is not without flaws. Anyone interested in learning a bit more about intrinsic value should have a read of the Simply Wall St analysis model.
See our latest analysis for Saferoads Holdings
The Method
We use what is known as a 2-stage model, which simply means we have two different periods of growth rates for the company's cash flows. Generally the first stage is higher growth, and the second stage is a lower growth phase. To start off with, we need to estimate the next ten years of cash flows. Seeing as no analyst estimates of free cash flow are available to us, we have extrapolate the previous free cash flow (FCF) from the company's last reported value. We assume companies with shrinking free cash flow will slow their rate of shrinkage, and that companies with growing free cash flow will see their growth rate slow, over this period. We do this to reflect that growth tends to slow more in the early years than it does in later years.
Generally we assume that a dollar today is more valuable than a dollar in the future, so we discount the value of these future cash flows to their estimated value in today's dollars:
10-year free cash flow (FCF) forecast
2024 | 2025 | 2026 | 2027 | 2028 | 2029 | 2030 | 2031 | 2032 | 2033 | |
Levered FCF (A$, Millions) | AU$318.1k | AU$253.8k | AU$219.5k | AU$200.2k | AU$189.2k | AU$183.1k | AU$180.2k | AU$179.3k | AU$179.9k | AU$181.5k |
Growth Rate Estimate Source | Est @ -29.80% | Est @ -20.21% | Est @ -13.50% | Est @ -8.80% | Est @ -5.51% | Est @ -3.21% | Est @ -1.60% | Est @ -0.47% | Est @ 0.32% | Est @ 0.87% |
Present Value (A$, Millions) Discounted @ 11% | AU$0.3 | AU$0.2 | AU$0.2 | AU$0.1 | AU$0.1 | AU$0.1 | AU$0.08 | AU$0.08 | AU$0.07 | AU$0.06 |
("Est" = FCF growth rate estimated by Simply Wall St)
Present Value of 10-year Cash Flow (PVCF) = AU$1.3m
After calculating the present value of future cash flows in the initial 10-year period, we need to calculate the Terminal Value, which accounts for all future cash flows beyond the first stage. For a number of reasons a very conservative growth rate is used that cannot exceed that of a country's GDP growth. In this case we have used the 5-year average of the 10-year government bond yield (2.2%) to estimate future growth. In the same way as with the 10-year 'growth' period, we discount future cash flows to today's value, using a cost of equity of 11%.
Terminal Value (TV)= FCF2033 × (1 + g) ÷ (r – g) = AU$181k× (1 + 2.2%) ÷ (11%– 2.2%) = AU$2.0m
Present Value of Terminal Value (PVTV)= TV / (1 + r)10= AU$2.0m÷ ( 1 + 11%)10= AU$687k
The total value is the sum of cash flows for the next ten years plus the discounted terminal value, which results in the Total Equity Value, which in this case is AU$2.0m. The last step is to then divide the equity value by the number of shares outstanding. Compared to the current share price of AU$0.05, the company appears around fair value at the time of writing. The assumptions in any calculation have a big impact on the valuation, so it is better to view this as a rough estimate, not precise down to the last cent.
Important Assumptions
The calculation above is very dependent on two assumptions. The first is the discount rate and the other is the cash flows. Part of investing is coming up with your own evaluation of a company's future performance, so try the calculation yourself and check your own assumptions. The DCF also does not consider the possible cyclicality of an industry, or a company's future capital requirements, so it does not give a full picture of a company's potential performance. Given that we are looking at Saferoads Holdings as potential shareholders, the cost of equity is used as the discount rate, rather than the cost of capital (or weighted average cost of capital, WACC) which accounts for debt. In this calculation we've used 11%, which is based on a levered beta of 2.000. Beta is a measure of a stock's volatility, compared to the market as a whole. We get our beta from the industry average beta of globally comparable companies, with an imposed limit between 0.8 and 2.0, which is a reasonable range for a stable business.
SWOT Analysis for Saferoads Holdings
Strength
Debt is well covered by earnings and cashflows.
Weakness
Current share price is above our estimate of fair value.
Shareholders have been diluted in the past year.
Opportunity
Has sufficient cash runway for more than 3 years based on current free cash flows.
Lack of analyst coverage makes it difficult to determine SRH's earnings prospects.
Threat
No apparent threats visible for SRH.
Moving On:
Valuation is only one side of the coin in terms of building your investment thesis, and it is only one of many factors that you need to assess for a company. DCF models are not the be-all and end-all of investment valuation. Rather it should be seen as a guide to "what assumptions need to be true for this stock to be under/overvalued?" For example, changes in the company's cost of equity or the risk free rate can significantly impact the valuation. For Saferoads Holdings, we've compiled three pertinent items you should further examine:
Risks: Consider for instance, the ever-present spectre of investment risk. We've identified 4 warning signs with Saferoads Holdings (at least 3 which make us uncomfortable) , and understanding these should be part of your investment process.
Other High Quality Alternatives: Do you like a good all-rounder? Explore our interactive list of high quality stocks to get an idea of what else is out there you may be missing!
Other Top Analyst Picks: Interested to see what the analysts are thinking? Take a look at our interactive list of analysts' top stock picks to find out what they feel might have an attractive future outlook!
PS. Simply Wall St updates its DCF calculation for every Australian stock every day, so if you want to find the intrinsic value of any other stock just search here.
Have feedback on this article? Concerned about the content? Get in touch with us directly. Alternatively, email editorial-team (at) simplywallst.com.
This article by Simply Wall St is general in nature. We provide commentary based on historical data and analyst forecasts only using an unbiased methodology and our articles are not intended to be financial advice. It does not constitute a recommendation to buy or sell any stock, and does not take account of your objectives, or your financial situation. We aim to bring you long-term focused analysis driven by fundamental data. Note that our analysis may not factor in the latest price-sensitive company announcements or qualitative material. Simply Wall St has no position in any stocks mentioned.
