
 Yahoo Finance
 Calculating The Intrinsic Value Of United Homes Group, Inc. (NASDAQ:UHG)
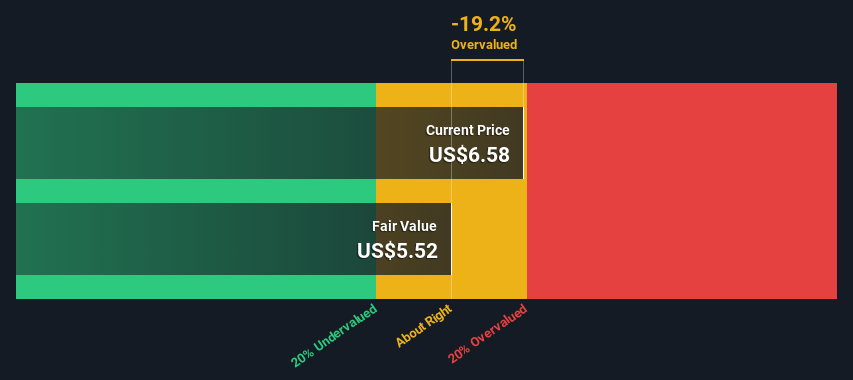
Key Insights
The projected fair value for United Homes Group is US$5.52 based on 2 Stage Free Cash Flow to Equity
With US$6.58 share price, United Homes Group appears to be trading close to its estimated fair value
Today we'll do a simple run through of a valuation method used to estimate the attractiveness of United Homes Group, Inc. (NASDAQ:UHG) as an investment opportunity by estimating the company's future cash flows and discounting them to their present value. This will be done using the Discounted Cash Flow (DCF) model. Before you think you won't be able to understand it, just read on! It's actually much less complex than you'd imagine.
We generally believe that a company's value is the present value of all of the cash it will generate in the future. However, a DCF is just one valuation metric among many, and it is not without flaws. If you want to learn more about discounted cash flow, the rationale behind this calculation can be read in detail in the Simply Wall St analysis model.
View our latest analysis for United Homes Group
The Model
We are going to use a two-stage DCF model, which, as the name states, takes into account two stages of growth. The first stage is generally a higher growth period which levels off heading towards the terminal value, captured in the second 'steady growth' period. To start off with, we need to estimate the next ten years of cash flows. Seeing as no analyst estimates of free cash flow are available to us, we have extrapolate the previous free cash flow (FCF) from the company's last reported value. We assume companies with shrinking free cash flow will slow their rate of shrinkage, and that companies with growing free cash flow will see their growth rate slow, over this period. We do this to reflect that growth tends to slow more in the early years than it does in later years.
Generally we assume that a dollar today is more valuable than a dollar in the future, so we discount the value of these future cash flows to their estimated value in today's dollars:
10-year free cash flow (FCF) forecast
2024 | 2025 | 2026 | 2027 | 2028 | 2029 | 2030 | 2031 | 2032 | 2033 | |
Levered FCF ($, Millions) | US$24.5m | US$22.5m | US$21.4m | US$20.8m | US$20.6m | US$20.5m | US$20.6m | US$20.9m | US$21.2m | US$21.5m |
Growth Rate Estimate Source | Est @ -12.46% | Est @ -8.04% | Est @ -4.94% | Est @ -2.77% | Est @ -1.25% | Est @ -0.19% | Est @ 0.55% | Est @ 1.08% | Est @ 1.44% | Est @ 1.69% |
Present Value ($, Millions) Discounted @ 9.3% | US$22.4 | US$18.9 | US$16.4 | US$14.6 | US$13.2 | US$12.1 | US$11.1 | US$10.3 | US$9.5 | US$8.9 |
("Est" = FCF growth rate estimated by Simply Wall St)
Present Value of 10-year Cash Flow (PVCF) = US$137m
We now need to calculate the Terminal Value, which accounts for all the future cash flows after this ten year period. The Gordon Growth formula is used to calculate Terminal Value at a future annual growth rate equal to the 5-year average of the 10-year government bond yield of 2.3%. We discount the terminal cash flows to today's value at a cost of equity of 9.3%.
Terminal Value (TV)= FCF2033 × (1 + g) ÷ (r – g) = US$22m× (1 + 2.3%) ÷ (9.3%– 2.3%) = US$315m
Present Value of Terminal Value (PVTV)= TV / (1 + r)10= US$315m÷ ( 1 + 9.3%)10= US$130m
The total value is the sum of cash flows for the next ten years plus the discounted terminal value, which results in the Total Equity Value, which in this case is US$267m. The last step is to then divide the equity value by the number of shares outstanding. Compared to the current share price of US$6.6, the company appears around fair value at the time of writing. The assumptions in any calculation have a big impact on the valuation, so it is better to view this as a rough estimate, not precise down to the last cent.
Important Assumptions
Now the most important inputs to a discounted cash flow are the discount rate, and of course, the actual cash flows. You don't have to agree with these inputs, I recommend redoing the calculations yourself and playing with them. The DCF also does not consider the possible cyclicality of an industry, or a company's future capital requirements, so it does not give a full picture of a company's potential performance. Given that we are looking at United Homes Group as potential shareholders, the cost of equity is used as the discount rate, rather than the cost of capital (or weighted average cost of capital, WACC) which accounts for debt. In this calculation we've used 9.3%, which is based on a levered beta of 1.520. Beta is a measure of a stock's volatility, compared to the market as a whole. We get our beta from the industry average beta of globally comparable companies, with an imposed limit between 0.8 and 2.0, which is a reasonable range for a stable business.
SWOT Analysis for United Homes Group
Strength
Earnings growth over the past year exceeded the industry.
Debt is well covered by earnings.
Weakness
Current share price is above our estimate of fair value.
Opportunity
UHG's financial characteristics indicate limited near-term opportunities for shareholders.
Lack of analyst coverage makes it difficult to determine UHG's earnings prospects.
Threat
Debt is not well covered by operating cash flow.
Total liabilities exceed total assets, which raises the risk of financial distress.
Moving On:
Whilst important, the DCF calculation shouldn't be the only metric you look at when researching a company. DCF models are not the be-all and end-all of investment valuation. Instead the best use for a DCF model is to test certain assumptions and theories to see if they would lead to the company being undervalued or overvalued. For instance, if the terminal value growth rate is adjusted slightly, it can dramatically alter the overall result. For United Homes Group, we've compiled three additional elements you should consider:
Risks: Case in point, we've spotted 3 warning signs for United Homes Group you should be aware of.
Other Solid Businesses: Low debt, high returns on equity and good past performance are fundamental to a strong business. Why not explore our interactive list of stocks with solid business fundamentals to see if there are other companies you may not have considered!
Other Top Analyst Picks: Interested to see what the analysts are thinking? Take a look at our interactive list of analysts' top stock picks to find out what they feel might have an attractive future outlook!
PS. Simply Wall St updates its DCF calculation for every American stock every day, so if you want to find the intrinsic value of any other stock just search here.
Have feedback on this article? Concerned about the content? Get in touch with us directly. Alternatively, email editorial-team (at) simplywallst.com.
This article by Simply Wall St is general in nature. We provide commentary based on historical data and analyst forecasts only using an unbiased methodology and our articles are not intended to be financial advice. It does not constitute a recommendation to buy or sell any stock, and does not take account of your objectives, or your financial situation. We aim to bring you long-term focused analysis driven by fundamental data. Note that our analysis may not factor in the latest price-sensitive company announcements or qualitative material. Simply Wall St has no position in any stocks mentioned.
