
 Yahoo Finance
 Capital Allocation Trends At Coda Octopus Group (NASDAQ:CODA) Aren't Ideal
To find a multi-bagger stock, what are the underlying trends we should look for in a business? Amongst other things, we'll want to see two things; firstly, a growing return on capital employed (ROCE) and secondly, an expansion in the company's amount of capital employed. Ultimately, this demonstrates that it's a business that is reinvesting profits at increasing rates of return. Although, when we looked at Coda Octopus Group (NASDAQ:CODA), it didn't seem to tick all of these boxes.
What Is Return On Capital Employed (ROCE)?
For those who don't know, ROCE is a measure of a company's yearly pre-tax profit (its return), relative to the capital employed in the business. To calculate this metric for Coda Octopus Group, this is the formula:
Return on Capital Employed = Earnings Before Interest and Tax (EBIT) ÷ (Total Assets - Current Liabilities)
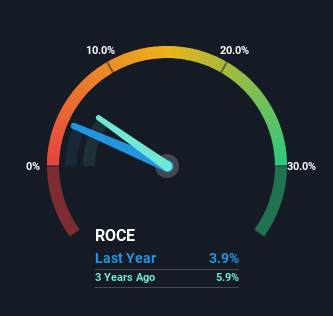
0.039 = US$1.9m ÷ (US$53m - US$2.8m) (Based on the trailing twelve months to January 2024).
Therefore, Coda Octopus Group has an ROCE of 3.9%. Ultimately, that's a low return and it under-performs the Electronic industry average of 11%.
See our latest analysis for Coda Octopus Group
In the above chart we have measured Coda Octopus Group's prior ROCE against its prior performance, but the future is arguably more important. If you're interested, you can view the analysts predictions in our free analyst report for Coda Octopus Group .
What Can We Tell From Coda Octopus Group's ROCE Trend?
On the surface, the trend of ROCE at Coda Octopus Group doesn't inspire confidence. To be more specific, ROCE has fallen from 17% over the last five years. Given the business is employing more capital while revenue has slipped, this is a bit concerning. This could mean that the business is losing its competitive advantage or market share, because while more money is being put into ventures, it's actually producing a lower return - "less bang for their buck" per se.
The Bottom Line
In summary, we're somewhat concerned by Coda Octopus Group's diminishing returns on increasing amounts of capital. Long term shareholders who've owned the stock over the last five years have experienced a 45% depreciation in their investment, so it appears the market might not like these trends either. That being the case, unless the underlying trends revert to a more positive trajectory, we'd consider looking elsewhere.
If you want to continue researching Coda Octopus Group, you might be interested to know about the 2 warning signs that our analysis has discovered.
While Coda Octopus Group may not currently earn the highest returns, we've compiled a list of companies that currently earn more than 25% return on equity. Check out this free list here.
Have feedback on this article? Concerned about the content? Get in touch with us directly. Alternatively, email editorial-team (at) simplywallst.com.
This article by Simply Wall St is general in nature. We provide commentary based on historical data and analyst forecasts only using an unbiased methodology and our articles are not intended to be financial advice. It does not constitute a recommendation to buy or sell any stock, and does not take account of your objectives, or your financial situation. We aim to bring you long-term focused analysis driven by fundamental data. Note that our analysis may not factor in the latest price-sensitive company announcements or qualitative material. Simply Wall St has no position in any stocks mentioned.
