
 Yahoo Finance
 Capital Allocation Trends At Domino's Pizza Enterprises (ASX:DMP) Aren't Ideal
Finding a business that has the potential to grow substantially is not easy, but it is possible if we look at a few key financial metrics. Amongst other things, we'll want to see two things; firstly, a growing return on capital employed (ROCE) and secondly, an expansion in the company's amount of capital employed. This shows us that it's a compounding machine, able to continually reinvest its earnings back into the business and generate higher returns. However, after investigating Domino's Pizza Enterprises (ASX:DMP), we don't think it's current trends fit the mold of a multi-bagger.
Return On Capital Employed (ROCE): What Is It?
For those that aren't sure what ROCE is, it measures the amount of pre-tax profits a company can generate from the capital employed in its business. Analysts use this formula to calculate it for Domino's Pizza Enterprises:
Return on Capital Employed = Earnings Before Interest and Tax (EBIT) ÷ (Total Assets - Current Liabilities)
0.082 = AU$178m ÷ (AU$2.8b - AU$604m) (Based on the trailing twelve months to December 2023).
So, Domino's Pizza Enterprises has an ROCE of 8.2%. On its own that's a low return on capital but it's in line with the industry's average returns of 8.2%.
See our latest analysis for Domino's Pizza Enterprises
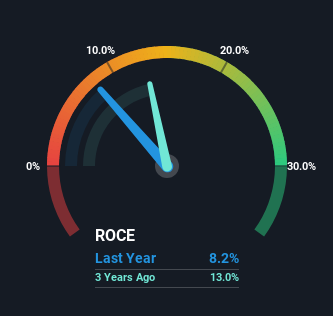
Above you can see how the current ROCE for Domino's Pizza Enterprises compares to its prior returns on capital, but there's only so much you can tell from the past. If you'd like to see what analysts are forecasting going forward, you should check out our free analyst report for Domino's Pizza Enterprises .
What Does the ROCE Trend For Domino's Pizza Enterprises Tell Us?
When we looked at the ROCE trend at Domino's Pizza Enterprises, we didn't gain much confidence. To be more specific, ROCE has fallen from 18% over the last five years. However, given capital employed and revenue have both increased it appears that the business is currently pursuing growth, at the consequence of short term returns. And if the increased capital generates additional returns, the business, and thus shareholders, will benefit in the long run.
What We Can Learn From Domino's Pizza Enterprises' ROCE
While returns have fallen for Domino's Pizza Enterprises in recent times, we're encouraged to see that sales are growing and that the business is reinvesting in its operations. These trends are starting to be recognized by investors since the stock has delivered a 4.6% gain to shareholders who've held over the last five years. Therefore we'd recommend looking further into this stock to confirm if it has the makings of a good investment.
Like most companies, Domino's Pizza Enterprises does come with some risks, and we've found 4 warning signs that you should be aware of.
For those who like to invest in solid companies, check out this free list of companies with solid balance sheets and high returns on equity.
Have feedback on this article? Concerned about the content? Get in touch with us directly. Alternatively, email editorial-team (at) simplywallst.com.
This article by Simply Wall St is general in nature. We provide commentary based on historical data and analyst forecasts only using an unbiased methodology and our articles are not intended to be financial advice. It does not constitute a recommendation to buy or sell any stock, and does not take account of your objectives, or your financial situation. We aim to bring you long-term focused analysis driven by fundamental data. Note that our analysis may not factor in the latest price-sensitive company announcements or qualitative material. Simply Wall St has no position in any stocks mentioned.
Have feedback on this article? Concerned about the content? Get in touch with us directly. Alternatively, email editorial-team@simplywallst.com
