
 Yahoo Finance
 Carnival (CCL) Beats on Q1 Earnings, Raises FY18 Guidance

Carnival Corporation and plc CCL reported better-than-expected fiscal first-quarter 2018 results.
Earnings of 52 cents per share surpassed the Zacks Consensus Estimate by 9 cents and improved 36.8% year over year. Revenues of $4.2 billion outpaced the consensus mark by $120.9 million and increased 11.6% year over year. This top-line growth year over year was driven by strength across passenger tickets, onboard and other, and tour and other businesses.
Net revenue yields rose 3.9% year over year on a constant-currency basis. The upswing can be attributed to higher net ticket, and net on-board and other yields that increased 4% and 3.9%, respectively, in constant currency.
In the reported quarter, the company benefited from ongoing guest experience efforts along with marketing and public relations programs that drove cruise ticket prices.
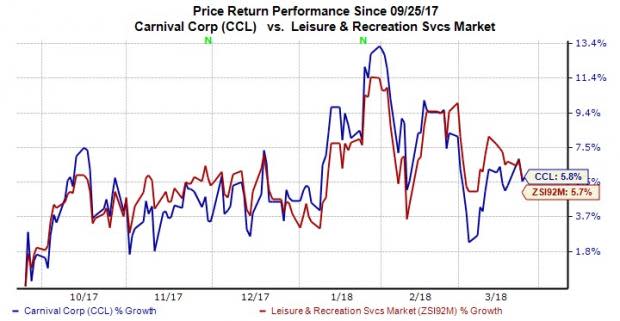
Notably, shares of Carnival have rallied 5.8% in the past six months, slightly outperforming the industry’s gain of 5.7%.
Let’s delve deeper into the numbers.
Revenues by Segments
Carnival generates revenues from its Passenger Tickets business, Onboard and Other as well as Tour and Other segments. Revenues at the Passenger Tickets business segment increased 12.3% year over year to $3.15 billion. Onboard and Other revenues totaled $1.07 billion, up 9.5% year over year. Tour and Other revenues increased 44.4% year over year to $13 million.
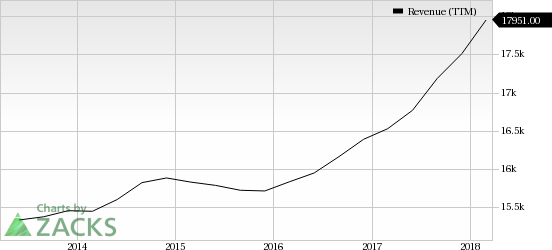
Carnival Corporation Revenue (TTM)
Carnival Corporation Revenue (TTM) | Carnival Corporation Quote
Expenses
Net cruise costs (in constant dollar) per available lower berth day (ALBD), excluding fuel, increased 1% and was better than the December guidance of 2-3% increase. Gross cruise costs (including fuel) per ALBD in current dollars increased 9%.
Balance Sheet
Carnival exited the first quarter with cash and cash equivalents of approximately $453 million, up from $395 million in the prior quarter. Trade and other receivables were $345 million, up from $312 million in the previous quarter. Long-term debt was approximately $7.4 billion.
Cash from operations was around $1.06 billion. In the quarter under review, the company had spent $574 million on capital expenditures and $323 million on dividends.
Second-Quarter 2018 Guidance
Fiscal second-quarter 2018 net revenue yields, in constant dollars, are expected to increase in the band of 2.5-3.5% year over year. Net cruise costs, excluding fuel per ALBD, are anticipated to rise in the range of 4-5% from the prior year figure, on a constant-dollar basis.
Based on the above factors, the company expects adjusted earnings per share in the range of 56-60 cents. Currently, the Zacks Consensus Estimate for earnings is pegged at 50 cents per share.
Fiscal 2018 Guidance
The company raised its fiscal 2018 adjusted earnings per share guidance to the range of $4.20-$4.40, up from the previously guided range of $4.00-$4.30.
Based on current booking trends, the company expects fiscal 2018 net revenue yields, in constant currency, to be up approximately 2.5% compared with the previous year. Also, net cruise costs (in constant dollar) per ALBD, excluding fuel, for fiscal 2018 are anticipated to be up nearly 1% year over year, on a constant-currency basis.
Management noted that cumulative advance bookings for fiscal 2018 are well ahead of the year-ago level at significantly higher prices.
Zacks Rank & Stocks to Consider
Carnival has a Zacks Rank #3 (Hold). Some better-ranked stocks in the same space include Bluegreen Vacations Corp. BXG, Speedway Motorsports TRK and The Marcus Corp. MCS, each carrying a Zacks Rank #2 (Buy). You can see the complete list of today’s Zacks #1 Rank (Strong Buy) stocks here.
Bluegreen Vacations, Speedway Motorsports and The Marcus Corp. earnings for 2018 are expected to grow 19.3%, 35.3% and 16.9%, respectively.
Can Hackers Put Money INTO Your Portfolio?
Earlier this month, credit bureau Equifax announced a massive data breach affecting 2 out of every 3 Americans. The cybersecurity industry is expanding quickly in response to this and similar events. But some stocks are better investments than others.
Zacks has just released Cybersecurity! An Investor’s Guide to help Zacks.com readers make the most of the $170 billion per year investment opportunity created by hackers and other threats. It reveals 4 stocks worth looking into right away.
Download the new report now>>
Want the latest recommendations from Zacks Investment Research? Today, you can download 7 Best Stocks for the Next 30 Days. Click to get this free report
Marcus Corporation (The) (MCS) : Free Stock Analysis Report
Carnival Corporation (CCL) : Free Stock Analysis Report
Speedway Motorsports, Inc. (TRK) : Free Stock Analysis Report
Bluegreen Vacations Corporation (BXG) : Free Stock Analysis Report
To read this article on Zacks.com click here.
Zacks Investment Research
