
 Yahoo Finance
 The Case For The Berkeley Group Holdings plc (LON:BKG): Could It Be A Nice Addition To Your Dividend Portfolio?

Could The Berkeley Group Holdings plc (LON:BKG) be an attractive dividend share to own for the long haul? Investors are often drawn to strong companies with the idea of reinvesting the dividends. On the other hand, investors have been known to buy a stock because of its yield, and then lose money if the company's dividend doesn't live up to expectations.
With a seven-year payment history and a 3.1% yield, many investors probably find Berkeley Group Holdings intriguing. It sure looks interesting on these metrics - but there's always more to the story . During the year, the company also conducted a buyback equivalent to around 2.7% of its market capitalisation. Some simple research can reduce the risk of buying Berkeley Group Holdings for its dividend - read on to learn more.
Explore this interactive chart for our latest analysis on Berkeley Group Holdings!
Payout ratios
Dividends are typically paid from company earnings. If a company pays more in dividends than it earned, then the dividend might become unsustainable - hardly an ideal situation. As a result, we should always investigate whether a company can afford its dividend, measured as a percentage of a company's net income after tax. Berkeley Group Holdings paid out 29% of its profit as dividends, over the trailing twelve month period. A medium payout ratio strikes a good balance between paying dividends, and keeping enough back to invest in the business. One of the risks is that management reinvests the retained capital poorly instead of paying a higher dividend.
In addition to comparing dividends against profits, we should inspect whether the company generated enough cash to pay its dividend. Berkeley Group Holdings's cash payout ratio last year was 13%, which is quite low and suggests that the dividend was thoroughly covered by cash flow. It's positive to see that Berkeley Group Holdings's dividend is covered by both profits and cash flow, since this is generally a sign that the dividend is sustainable, and a lower payout ratio usually suggests a greater margin of safety before the dividend gets cut.
While the above analysis focuses on dividends relative to a company's earnings, we do note Berkeley Group Holdings's strong net cash position, which will let it pay larger dividends for a time, should it choose.
Consider getting our latest analysis on Berkeley Group Holdings's financial position here.
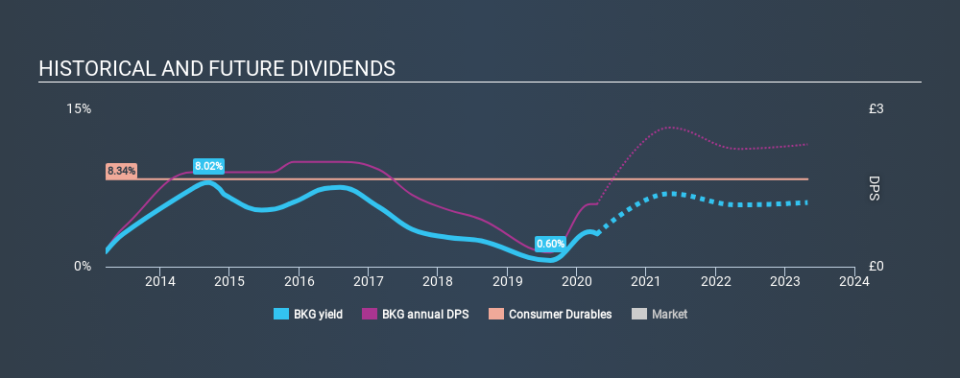
Dividend Volatility
One of the major risks of relying on dividend income, is the potential for a company to struggle financially and cut its dividend. Not only is your income cut, but the value of your investment declines as well - nasty. Berkeley Group Holdings has been paying a dividend for the past seven years. It's good to see that Berkeley Group Holdings has been paying a dividend for a number of years. However, the dividend has been cut at least once in the past, and we're concerned that what has been cut once, could be cut again. During the past seven-year period, the first annual payment was UK£0.30 in 2013, compared to UK£1.19 last year. Dividends per share have grown at approximately 22% per year over this time. The dividends haven't grown at precisely 22% every year, but this is a useful way to average out the historical rate of growth.
It's not great to see that the payment has been cut in the past. We're generally more wary of companies that have cut their dividend before, as they tend to perform worse in an economic downturn.
Dividend Growth Potential
Given that the dividend has been cut in the past, we need to check if earnings are growing and if that might lead to stronger dividends in the future. It's good to see Berkeley Group Holdings has been growing its earnings per share at 13% a year over the past five years. A company paying out less than a quarter of its earnings as dividends, and growing earnings at more than 10% per annum, looks to be right in the cusp of its growth phase. At the right price, we might be interested.
Conclusion
When we look at a dividend stock, we need to form a judgement on whether the dividend will grow, if the company is able to maintain it in a wide range of economic circumstances, and if the dividend payout is sustainable. It's great to see that Berkeley Group Holdings is paying out a low percentage of its earnings and cash flow. Next, earnings growth has been good, but unfortunately the dividend has been cut at least once in the past. Berkeley Group Holdings performs highly under this analysis, although it falls slightly short of our exacting standards. At the right valuation, it could be a solid dividend prospect.
Investors generally tend to favour companies with a consistent, stable dividend policy as opposed to those operating an irregular one. Meanwhile, despite the importance of dividend payments, they are not the only factors our readers should know when assessing a company. As an example, we've identified 3 warning signs for Berkeley Group Holdings that you should be aware of before investing.
We have also put together a list of global stocks with a market capitalisation above $1bn and yielding more 3%.
If you spot an error that warrants correction, please contact the editor at editorial-team@simplywallst.com. This article by Simply Wall St is general in nature. It does not constitute a recommendation to buy or sell any stock, and does not take account of your objectives, or your financial situation. Simply Wall St has no position in the stocks mentioned.
We aim to bring you long-term focused research analysis driven by fundamental data. Note that our analysis may not factor in the latest price-sensitive company announcements or qualitative material. Thank you for reading.
