
 Yahoo Finance
 Catapult Group International's (ASX:CAT) investors will be pleased with their decent 53% return over the last year
These days it's easy to simply buy an index fund, and your returns should (roughly) match the market. But if you pick the right individual stocks, you could make more than that. For example, the Catapult Group International Ltd (ASX:CAT) share price is up 53% in the last 1 year, clearly besting the market return of around 8.7% (not including dividends). That's a solid performance by our standards! In contrast, the longer term returns are negative, since the share price is 32% lower than it was three years ago.
With that in mind, it's worth seeing if the company's underlying fundamentals have been the driver of long term performance, or if there are some discrepancies.
See our latest analysis for Catapult Group International
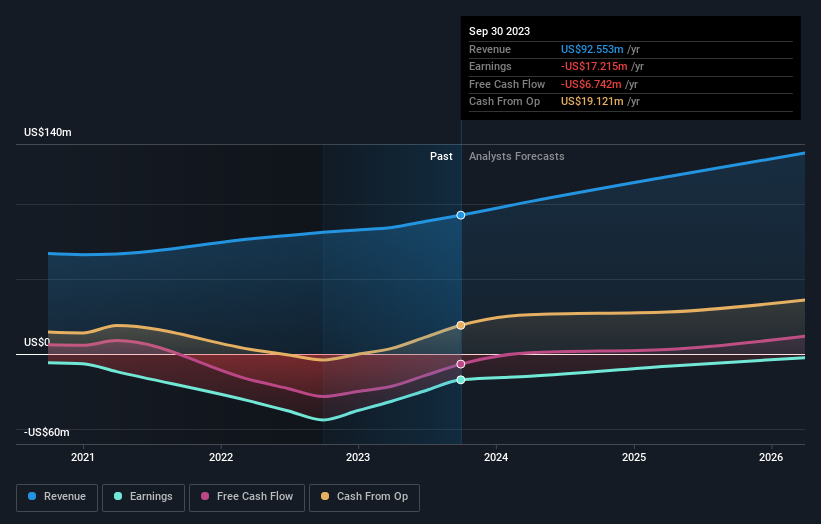
Catapult Group International isn't currently profitable, so most analysts would look to revenue growth to get an idea of how fast the underlying business is growing. Generally speaking, companies without profits are expected to grow revenue every year, and at a good clip. That's because it's hard to be confident a company will be sustainable if revenue growth is negligible, and it never makes a profit.
In the last year Catapult Group International saw its revenue grow by 14%. That's a fairly respectable growth rate. While the share price performed well, gaining 53% over twelve months, you could argue the revenue growth warranted it. If the company can maintain the revenue growth, the share price could go higher still. But it's crucial to check profitability and cash flow before forming a view on the future.
The graphic below depicts how earnings and revenue have changed over time (unveil the exact values by clicking on the image).
You can see how its balance sheet has strengthened (or weakened) over time in this free interactive graphic.
A Different Perspective
It's good to see that Catapult Group International has rewarded shareholders with a total shareholder return of 53% in the last twelve months. Since the one-year TSR is better than the five-year TSR (the latter coming in at 3% per year), it would seem that the stock's performance has improved in recent times. Given the share price momentum remains strong, it might be worth taking a closer look at the stock, lest you miss an opportunity. It's always interesting to track share price performance over the longer term. But to understand Catapult Group International better, we need to consider many other factors. Case in point: We've spotted 2 warning signs for Catapult Group International you should be aware of.
If you would prefer to check out another company -- one with potentially superior financials -- then do not miss this free list of companies that have proven they can grow earnings.
Please note, the market returns quoted in this article reflect the market weighted average returns of stocks that currently trade on Australian exchanges.
Have feedback on this article? Concerned about the content? Get in touch with us directly. Alternatively, email editorial-team (at) simplywallst.com.
This article by Simply Wall St is general in nature. We provide commentary based on historical data and analyst forecasts only using an unbiased methodology and our articles are not intended to be financial advice. It does not constitute a recommendation to buy or sell any stock, and does not take account of your objectives, or your financial situation. We aim to bring you long-term focused analysis driven by fundamental data. Note that our analysis may not factor in the latest price-sensitive company announcements or qualitative material. Simply Wall St has no position in any stocks mentioned.
