
 Yahoo Finance
 Century Casinos (NASDAQ:CNTY) shareholders have endured a 79% loss from investing in the stock three years ago
As every investor would know, not every swing hits the sweet spot. But really bad investments should be rare. So spare a thought for the long term shareholders of Century Casinos, Inc. (NASDAQ:CNTY); the share price is down a whopping 79% in the last three years. That would certainly shake our confidence in the decision to own the stock. And more recent buyers are having a tough time too, with a drop of 60% in the last year.
It's worthwhile assessing if the company's economics have been moving in lockstep with these underwhelming shareholder returns, or if there is some disparity between the two. So let's do just that.
Check out our latest analysis for Century Casinos
Century Casinos isn't currently profitable, so most analysts would look to revenue growth to get an idea of how fast the underlying business is growing. Generally speaking, companies without profits are expected to grow revenue every year, and at a good clip. As you can imagine, fast revenue growth, when maintained, often leads to fast profit growth.
Over three years, Century Casinos grew revenue at 18% per year. That's a pretty good rate of top-line growth. So it seems unlikely the 21% share price drop (each year) is entirely about the revenue. It could be that the losses were much larger than expected. This is exactly why investors need to diversify - even when a loss making company grows revenue, it can fail to deliver for shareholders.
The image below shows how earnings and revenue have tracked over time (if you click on the image you can see greater detail).
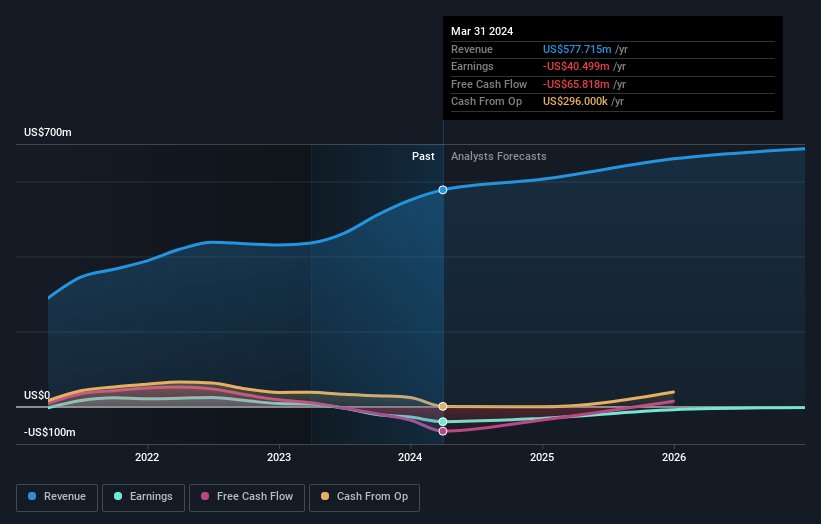
We like that insiders have been buying shares in the last twelve months. Having said that, most people consider earnings and revenue growth trends to be a more meaningful guide to the business. You can see what analysts are predicting for Century Casinos in this interactive graph of future profit estimates.
A Different Perspective
While the broader market gained around 28% in the last year, Century Casinos shareholders lost 60%. However, keep in mind that even the best stocks will sometimes underperform the market over a twelve month period. Regrettably, last year's performance caps off a bad run, with the shareholders facing a total loss of 11% per year over five years. Generally speaking long term share price weakness can be a bad sign, though contrarian investors might want to research the stock in hope of a turnaround. It's always interesting to track share price performance over the longer term. But to understand Century Casinos better, we need to consider many other factors. Case in point: We've spotted 2 warning signs for Century Casinos you should be aware of.
Century Casinos is not the only stock insiders are buying. So take a peek at this free list of small cap companies at attractive valuations which insiders have been buying.
Please note, the market returns quoted in this article reflect the market weighted average returns of stocks that currently trade on American exchanges.
Have feedback on this article? Concerned about the content? Get in touch with us directly. Alternatively, email editorial-team (at) simplywallst.com.
This article by Simply Wall St is general in nature. We provide commentary based on historical data and analyst forecasts only using an unbiased methodology and our articles are not intended to be financial advice. It does not constitute a recommendation to buy or sell any stock, and does not take account of your objectives, or your financial situation. We aim to bring you long-term focused analysis driven by fundamental data. Note that our analysis may not factor in the latest price-sensitive company announcements or qualitative material. Simply Wall St has no position in any stocks mentioned.
