
 Yahoo Finance
 Is Cerillion Plc's (LON:CER) Stock's Recent Performance A Reflection Of Its Financial Health?
Cerillion's (LON:CER) stock is up by 3.6% over the past month. Given its impressive performance, we decided to study the company's key financial indicators as a company's long-term fundamentals usually dictate market outcomes. Particularly, we will be paying attention to Cerillion's ROE today.
Return on equity or ROE is a key measure used to assess how efficiently a company's management is utilizing the company's capital. Simply put, it is used to assess the profitability of a company in relation to its equity capital.
Check out our latest analysis for Cerillion
How Is ROE Calculated?
The formula for ROE is:
Return on Equity = Net Profit (from continuing operations) ÷ Shareholders' Equity
So, based on the above formula, the ROE for Cerillion is:
35% = UK£13m ÷ UK£37m (Based on the trailing twelve months to September 2023).
The 'return' is the yearly profit. So, this means that for every £1 of its shareholder's investments, the company generates a profit of £0.35.
What Has ROE Got To Do With Earnings Growth?
We have already established that ROE serves as an efficient profit-generating gauge for a company's future earnings. Based on how much of its profits the company chooses to reinvest or "retain", we are then able to evaluate a company's future ability to generate profits. Assuming everything else remains unchanged, the higher the ROE and profit retention, the higher the growth rate of a company compared to companies that don't necessarily bear these characteristics.
A Side By Side comparison of Cerillion's Earnings Growth And 35% ROE
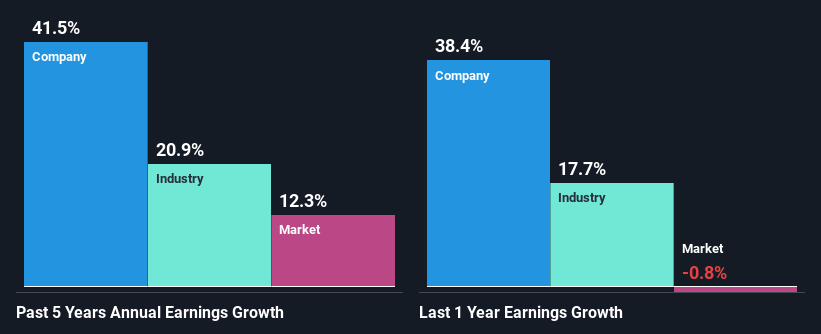
First thing first, we like that Cerillion has an impressive ROE. Secondly, even when compared to the industry average of 7.6% the company's ROE is quite impressive. So, the substantial 42% net income growth seen by Cerillion over the past five years isn't overly surprising.
We then compared Cerillion's net income growth with the industry and we're pleased to see that the company's growth figure is higher when compared with the industry which has a growth rate of 21% in the same 5-year period.
The basis for attaching value to a company is, to a great extent, tied to its earnings growth. The investor should try to establish if the expected growth or decline in earnings, whichever the case may be, is priced in. By doing so, they will have an idea if the stock is headed into clear blue waters or if swampy waters await. Is Cerillion fairly valued compared to other companies? These 3 valuation measures might help you decide.
Is Cerillion Making Efficient Use Of Its Profits?
Cerillion has a three-year median payout ratio of 29% (where it is retaining 71% of its income) which is not too low or not too high. By the looks of it, the dividend is well covered and Cerillion is reinvesting its profits efficiently as evidenced by its exceptional growth which we discussed above.
Besides, Cerillion has been paying dividends over a period of eight years. This shows that the company is committed to sharing profits with its shareholders. Our latest analyst data shows that the future payout ratio of the company over the next three years is expected to be approximately 25%. As a result, Cerillion's ROE is not expected to change by much either, which we inferred from the analyst estimate of 29% for future ROE.
Conclusion
On the whole, we feel that Cerillion's performance has been quite good. In particular, it's great to see that the company is investing heavily into its business and along with a high rate of return, that has resulted in a sizeable growth in its earnings. Having said that, the company's earnings growth is expected to slow down, as forecasted in the current analyst estimates. To know more about the latest analysts predictions for the company, check out this visualization of analyst forecasts for the company.
Have feedback on this article? Concerned about the content? Get in touch with us directly. Alternatively, email editorial-team (at) simplywallst.com.
This article by Simply Wall St is general in nature. We provide commentary based on historical data and analyst forecasts only using an unbiased methodology and our articles are not intended to be financial advice. It does not constitute a recommendation to buy or sell any stock, and does not take account of your objectives, or your financial situation. We aim to bring you long-term focused analysis driven by fundamental data. Note that our analysis may not factor in the latest price-sensitive company announcements or qualitative material. Simply Wall St has no position in any stocks mentioned.
