
 Yahoo Finance
 CES Energy Solutions' (TSE:CEU) Returns On Capital Are Heading Higher
What are the early trends we should look for to identify a stock that could multiply in value over the long term? Typically, we'll want to notice a trend of growing return on capital employed (ROCE) and alongside that, an expanding base of capital employed. Put simply, these types of businesses are compounding machines, meaning they are continually reinvesting their earnings at ever-higher rates of return. So on that note, CES Energy Solutions (TSE:CEU) looks quite promising in regards to its trends of return on capital.
Understanding Return On Capital Employed (ROCE)
For those that aren't sure what ROCE is, it measures the amount of pre-tax profits a company can generate from the capital employed in its business. Analysts use this formula to calculate it for CES Energy Solutions:
Return on Capital Employed = Earnings Before Interest and Tax (EBIT) ÷ (Total Assets - Current Liabilities)
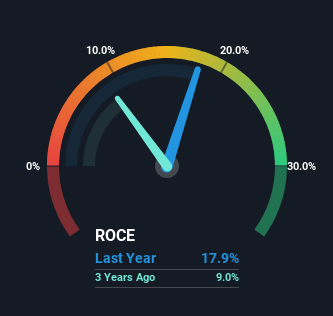
0.18 = CA$202m ÷ (CA$1.4b - CA$267m) (Based on the trailing twelve months to March 2023).
Thus, CES Energy Solutions has an ROCE of 18%. On its own, that's a standard return, however it's much better than the 12% generated by the Energy Services industry.
Check out our latest analysis for CES Energy Solutions
Above you can see how the current ROCE for CES Energy Solutions compares to its prior returns on capital, but there's only so much you can tell from the past. If you're interested, you can view the analysts predictions in our free report on analyst forecasts for the company.
What Can We Tell From CES Energy Solutions' ROCE Trend?
CES Energy Solutions has not disappointed with their ROCE growth. Looking at the data, we can see that even though capital employed in the business has remained relatively flat, the ROCE generated has risen by 160% over the last five years. Basically the business is generating higher returns from the same amount of capital and that is proof that there are improvements in the company's efficiencies. The company is doing well in that sense, and it's worth investigating what the management team has planned for long term growth prospects.
Our Take On CES Energy Solutions' ROCE
In summary, we're delighted to see that CES Energy Solutions has been able to increase efficiencies and earn higher rates of return on the same amount of capital. Given the stock has declined 31% in the last five years, this could be a good investment if the valuation and other metrics are also appealing. So researching this company further and determining whether or not these trends will continue seems justified.
If you want to know some of the risks facing CES Energy Solutions we've found 2 warning signs (1 makes us a bit uncomfortable!) that you should be aware of before investing here.
For those who like to invest in solid companies, check out this free list of companies with solid balance sheets and high returns on equity.
Have feedback on this article? Concerned about the content? Get in touch with us directly. Alternatively, email editorial-team (at) simplywallst.com.
This article by Simply Wall St is general in nature. We provide commentary based on historical data and analyst forecasts only using an unbiased methodology and our articles are not intended to be financial advice. It does not constitute a recommendation to buy or sell any stock, and does not take account of your objectives, or your financial situation. We aim to bring you long-term focused analysis driven by fundamental data. Note that our analysis may not factor in the latest price-sensitive company announcements or qualitative material. Simply Wall St has no position in any stocks mentioned.
